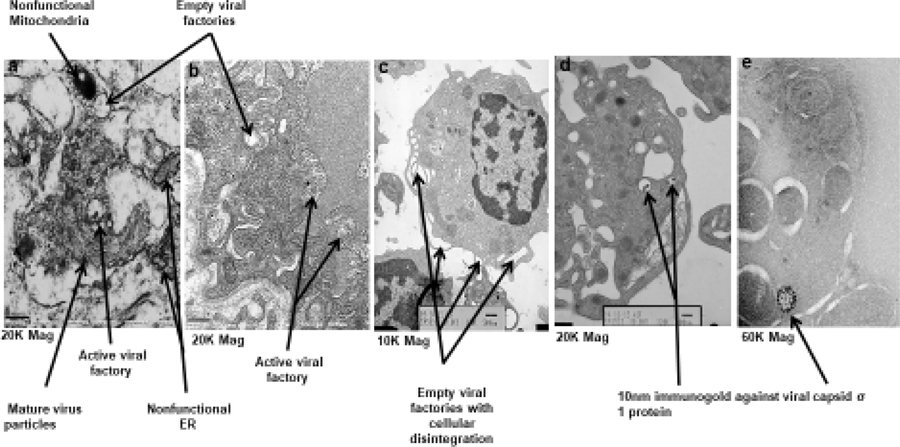
Figure 2.
This figure depicts the key findings from electron micrographs representing the process of virus propagation. Figure 3a shows empty and active viral factories as well as nonfunctional subcellular organelles including mitochondria and endoplasmic reticulum confirming that the cell is dying. Figure 3b shows several active viral factories. Figure 3c indicates the process of cellular disintegration at points of empty viral factories. Figure 3d and 3e is immunogold staining of the tumor sample obtained by biopsy of a patient using 10nm gold particles to detect the localization of pelareorep sigma 1 capsid protein again seen confined to viral factories (60X mag).

