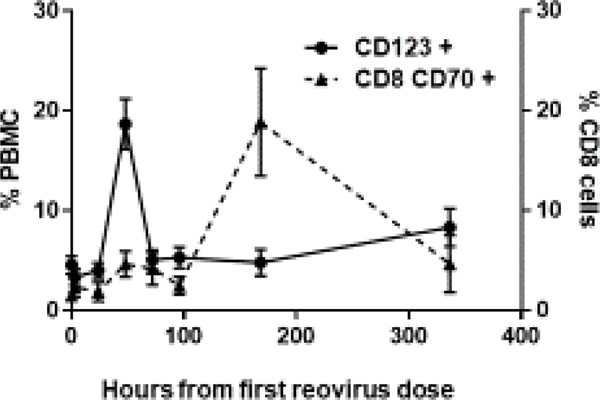
Figure 3a.
The figure represents the FACS analysis of changes in circulating immune cells. Samples were collected from 5 patients treated at the RPTD over 14 cycles. The graphs depict mean and SEM. A rapid peak of the dendritic cell maturation was observed at 48 hours, followed by the activation of CD8 T cells at 7 days.

