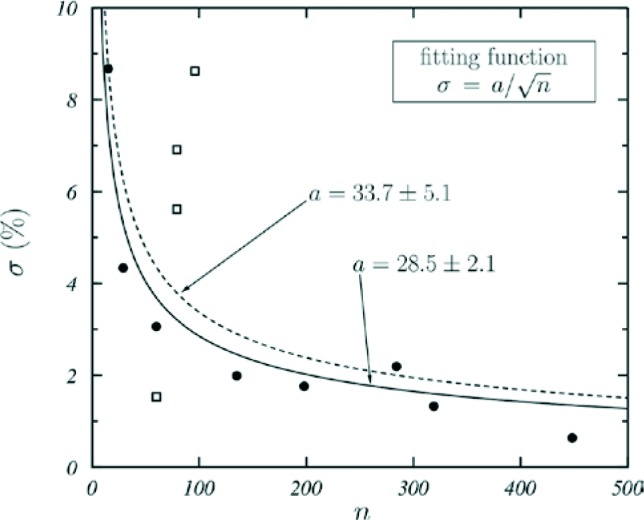
Fig. 1.

σ, defined in equation (6) vs. the number of patients n of clinical studies with CI available. The curves are fits of the function σ = a n –½ to all data (dashed curve) and to data shown with solid circles (solid curve), excluding the outliers (open squares). The values of the fitting parameter a in both cases are given
