
FIG. 2.
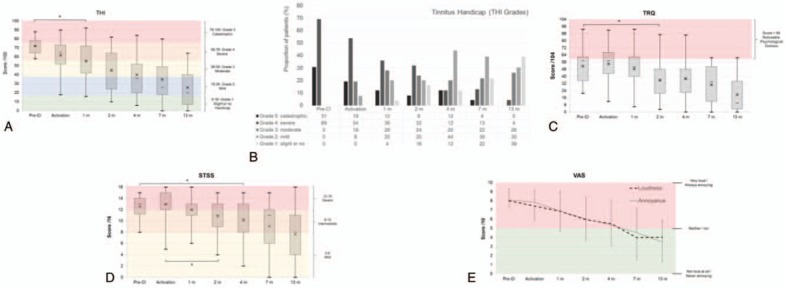
Results on questionnaires and VAS. A, Evolution of the THI score during follow-up. Box and whisker plots are minimum values, 1st quartile, median (horizontal bar), mean (cross), 3rd quartile, and maximal values. The different color-shaded areas indicate the different grades of THI: grade 1 (0–16, green), grade 2 (18–36, blue), grade 3 (38–56, yellow), grade 4 (58–76, orange), and grade 5 (78–100, red). B, Evolution of the THI grades during follow-up. Proportion of tested patients in different tinnitus handicap grades from THI. C, Evolution of the TRQ scores during follow-up. Noticeable psychological distress is in the red shaded area (scores >60). Box and whisker plots show minimum values, the 1st quartile, median (horizontal bar), mean (cross), 3rd quartile, and maximal value. D, Evolution of the STSS scores during follow-up. The grades are indicated by color-shaded areas: scores <8 = mild—yellow, 8 < scores < 12 = intermediate—orange, and scores >12 = severe—red. Box and whiskers plots show the minimum value, 1st quartile, median (horizontal bar), mean (cross), 3rd quartile, and maximal value. E, VAS loudness and annoyance outcomes during follow-up. Results are expressed as mean with standard deviation. Positive judgments are in the green area (not intense/not annoying) and negative ratings are in the red area (intense/annoying). STSS indicates Subjective Tinnitus Severity Scale; THI, Tinnitus Handicap Inventory; TRQ, Tinnitus Reaction Questionnaire; VAS, visual analogue scale.