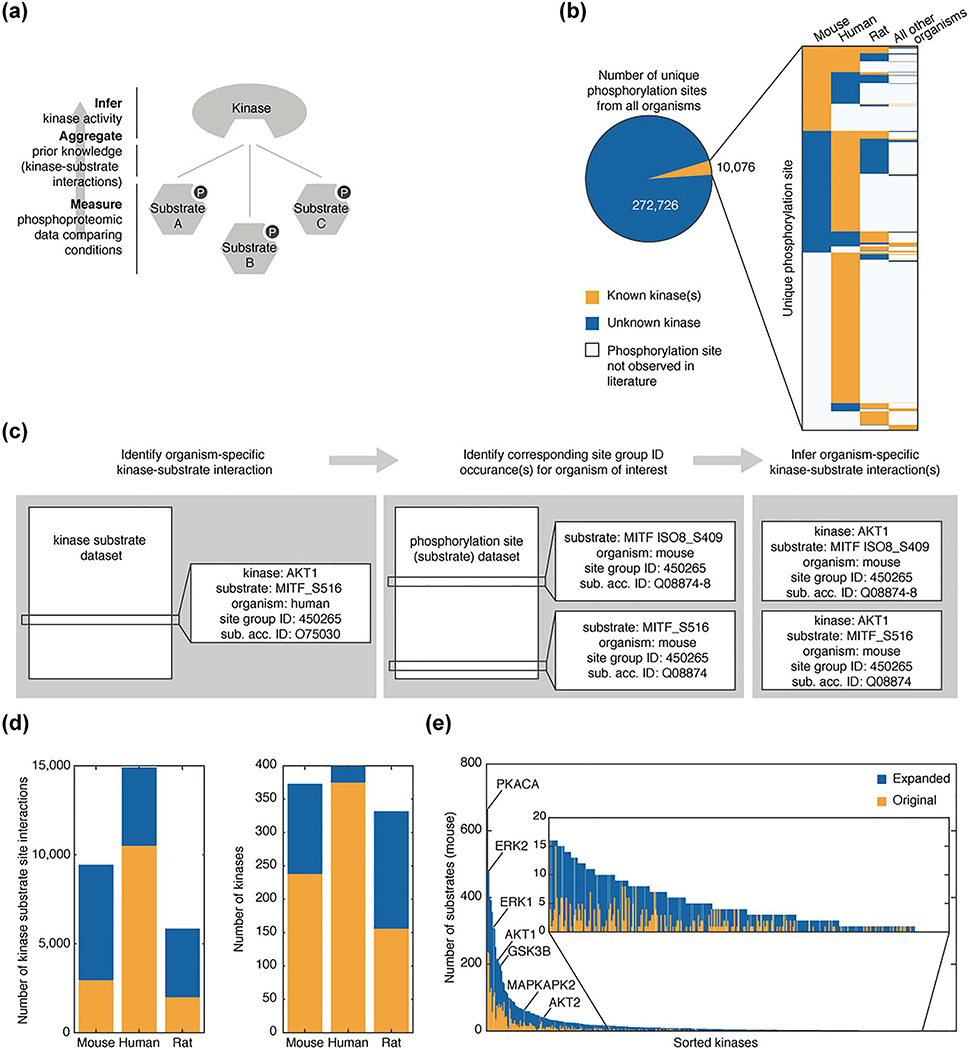
Figure 1.
Expansion of organism-specific kinase substrate datasets. (a) Workflow diagram illustrating bottom-up approach to infer kinase activity from prior knowledge and phosphoproteomic data. (b) Analysis of the number of unique phosphorylation sites with (orange) and without (blue) at least one known associated kinase from the kinase substrate dataset and phosphorylation site dataset available from PhosphoSitePlus as of 2017–10-02. Inset presents the organism breakdown of substrate sites within the set of kinase associated sites. Substrate sites for which organism-specific phosphorylation is not observed in the literature are shown in white. (c) Example illustrating process to expand kinase substrate dataset for mice. (d) Comparison of organism-specific kinase-substrate sets for mouse, rat, and human within the original dataset (orange) and after the expansion (blue). (e) The number of mouse substrates associated with each kinase in the original dataset (orange) and after expansion (blue) are ordered based on substrate set size after expansion.

