Figure 2.
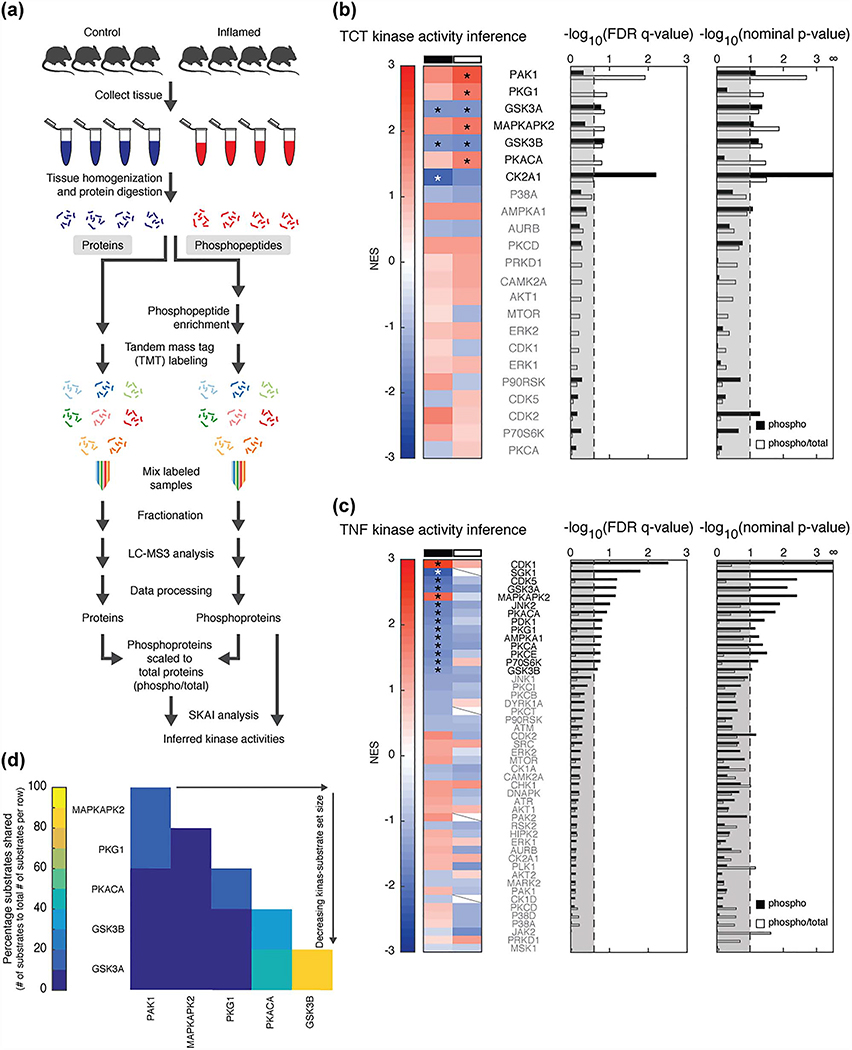
SKAI reveals activated kinases. (a) MS workflow. (b and c) SKAI conducted on phosphoproteomic data (phospho, black) and phosphoproteomic scaled to total proteomic data (phospho/total, white) from (b) TCT and (c) TNFΔARE models. Enrichment compares the inflamed to control samples. Each line in the heat map represents the NES associated with a kinase (set size ≥5). Slashes indicate the kinase’s respective substrate set was not detected in the analysis due to insufficient (<5) substrates in the respective dataset. Bar graphs present FDR q-values and nominal p-values for each kinase; thresholds are at an FDR q-value <0.25 and nominal p-value <0.1. Kinases shown in bold and marked with an asterisk have results that meet these thresholds. (d) Substrate overlap in TCT SKAI results from analysis of phosphoproteomic scaled to total proteomic data.

