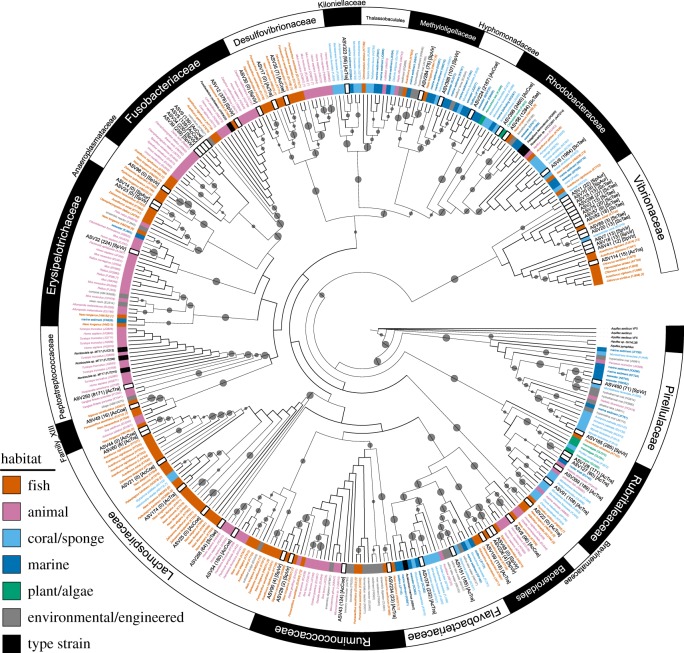
Figure 3.
Taxonomy and putative origin of the intestinal microbiome. Maximum-likelihood analysis of the 59 DA ASVs and their 297 closest relative sequences. Inner coloured ring corresponds to the assigned habitat category of closest relatives (based on isolation source). Tree leaves for top hits are labelled by their isolation source, a unique code in parentheses corresponding to an accession number, and—where also studied by Sullam et al. [48]—the ‘lifestyle’ category assigned by those authors in brackets. DA ASVs are labelled by their unique name, by the number of hits to the IMNGS database in parentheses, and in brackets by the fish species in which the ASV was DA. Outer ring depicts family level taxonomic affiliation. Grey dots are bootstrap values greater than 50 and dot size is proportional to the bootstrap value. A higher-resolution and interactive version of this tree—including all annotation data—is available at http://bit.ly/2QA5iTa. (Online version in colour.)

