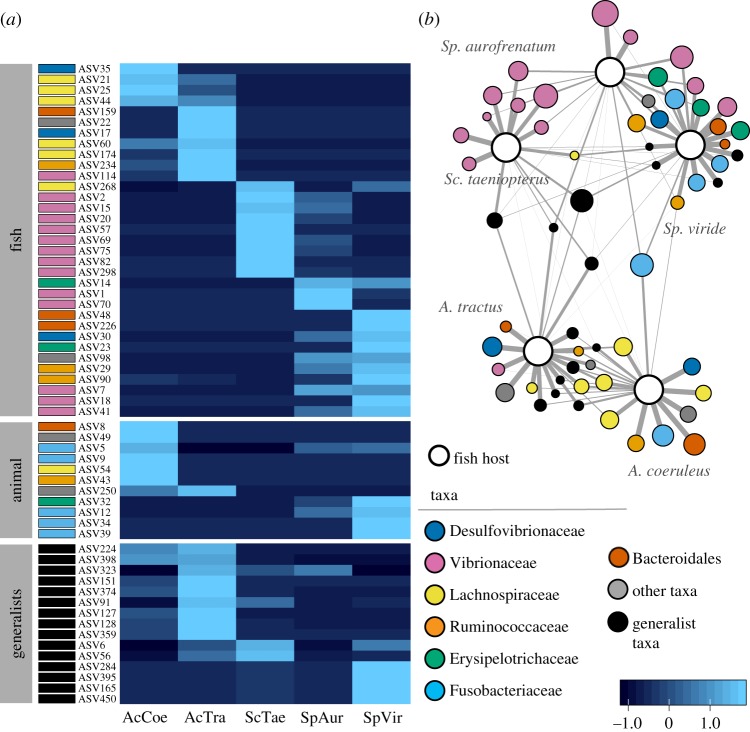
Figure 4.
Distribution of each dominant microbiome member. (a) Heatmap of read abundance for each DA ASV (row) found within each of the five fish species (columns). DA ASVs are organized first by putative habitat/lifestyle category and second by the fish species in which they were DA. (b) Network diagram, where nodes are either DA ASVs or one of the five host fish species. DA ASV node size is proportional to log-transformed read abundance, and edge thickness is weighted by the abundance of that DA ASV found within a given fish. Edges were filtered to exclude weights less than 0.2. Colour for both panels represents microbial taxa. Putative generalist taxa are grouped together, coloured black, and represent all DA ASVs classified as Alphaproteobacteria, Rubritaleaceae, Flavobacteriaceae and Pirellulaceae. (Online version in colour.)

