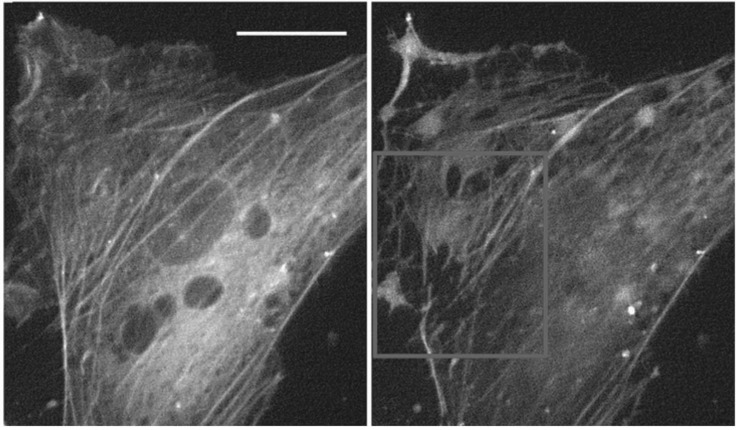
Figure 3.
Live yellow fluorescent protein-tagged actin network staining of cells before and 5 min after exposure to 290 kPa acoustic pressure showing massive fibre disruption. Scale bar 10 μm. Republished with permission from the Royal Society of Chemistry, from [17]; permission conveyed through Copyright Clearance. Center, Inc.

