
Figure 2.
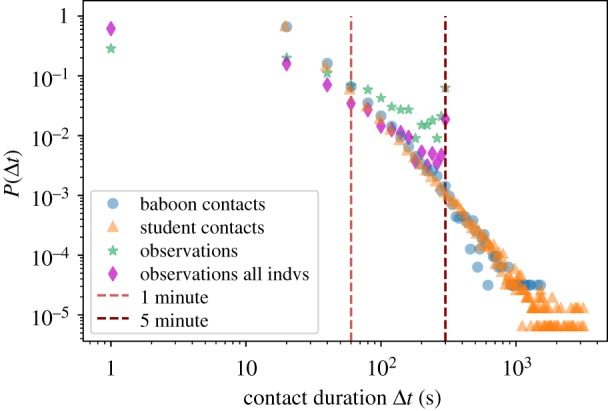
Durations of contacts and observed interactions. Distributions of durations for: contacts detected by the wearable sensor infrastructure (blue dots; average = 39.6 s, s.d. = 52.7 s, median = 20.0 s, max = 1520 s); contacts between students in a school in Utah (USA) measured by an infrastructure based on wireless ranging-enabled nodes (WRENs) [19] (orange triangles; average = 39.6 s, s.d. = 72.8 s, median = 19.5 s, max = 3164 s); state events in observed interactions (green stars for interactions involving only the 13 individuals with collars; average = 81.3 s, s.d. = 90.3 s, median = 41.0 s, max = 300 s; magenta diamonds for all interactions; average = 43.8 s, s.d. = 64.6 s, median = 18.0 s, max = 300 s). Note that, according to the observational method used in this study, individuals are observed for 5 min (300 s) at a time. The peak value at 300 s for the observation data is therefore an artefact of the observation method. (Online version in colour.)