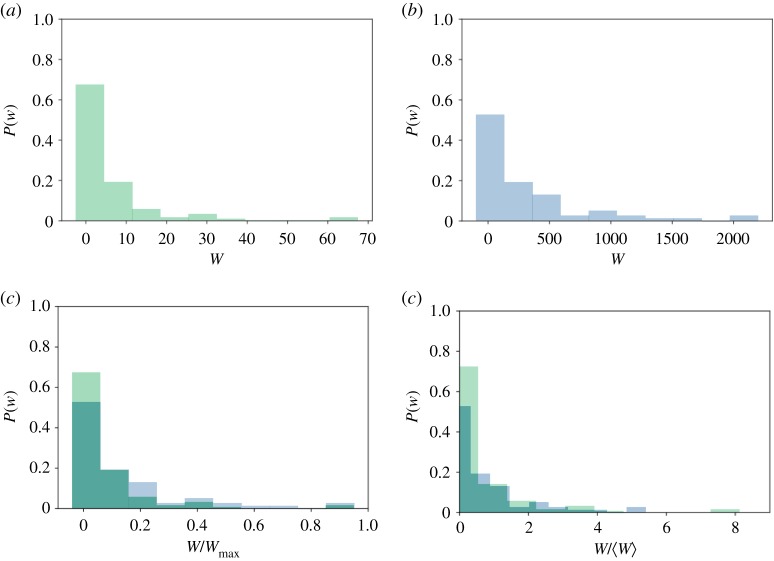
Figure 3.
Distributions of weights. Probability distributions of interaction (a) and contact (b) network weights. Despite the very different values of the weights, their distributions have similar shapes. In (c) and (d), the same distributions are shown after rescaling the weights of each network by either the maximum weight (c) or the average weight (d). (Online version in colour.)

