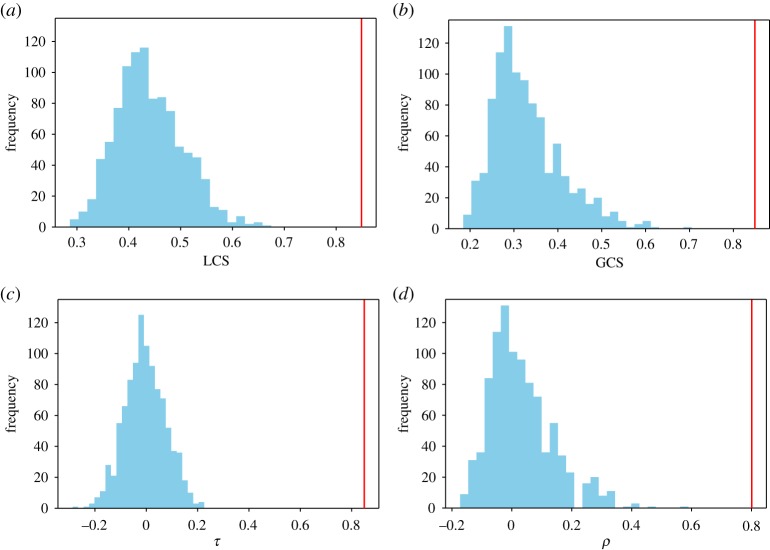
Figure 5.
Similarity metrics. Quantitative comparison between the contact network and the interaction network through several correlation and similarity measures. In each panel, the empirical value is presented as a vertical red line, together with the distribution of 1000 values (light blue) obtained using a null model in which the weights of the contact network were reshuffled and reassigned at random to the links. (a) Average of the LCS, i.e. average of the cosine similarity between the ego-networks of single nodes (empirical value: 0.91, distribution: average = 0.44, s.d. = 0.06). (b) GCS between the lists of weights of the two networks (empirical value: 0.84, distribution: average = 0.33, s.d. = 0.08). (c) Kendall rank correlation coefficient between the weights of the two networks (empirical value: 0.58, distribution: average = −0.004, s.d. = 0.080). (d) Pearson correlation coefficient between the weights (empirical value: 0.80, distribution: average = 0.04, s.d. = 0.11). (Online version in colour.)

