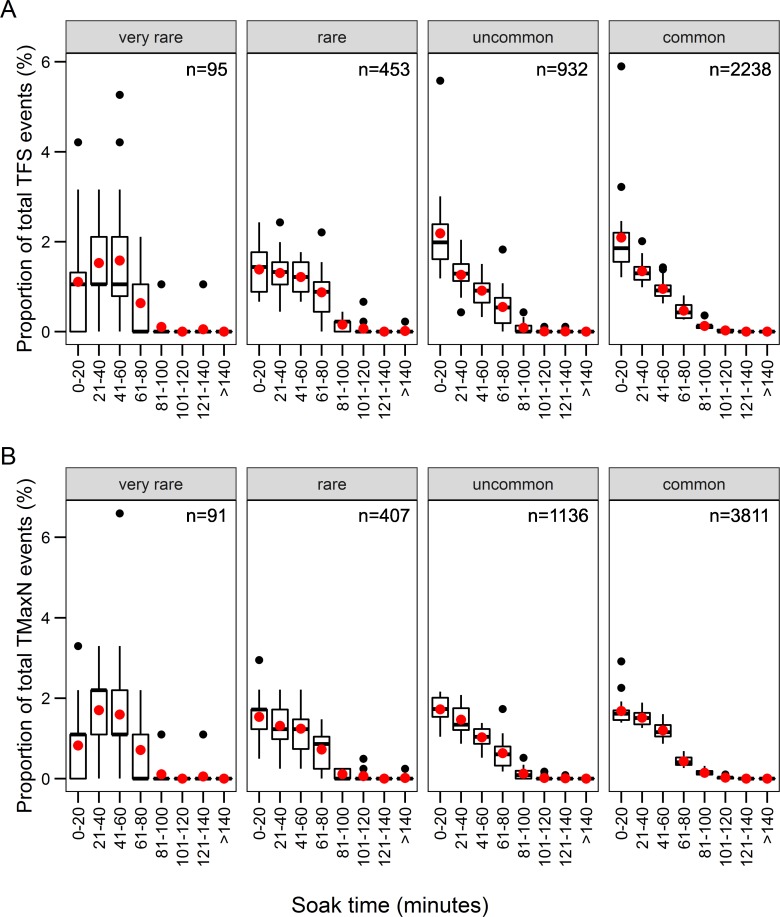
Fig 3. Proportions of species in rarity groups by soak time (minutes).
Species groups were categorised as ‘very rare’ (occurrence on ≤ 10 BRUVS), ‘rare’ (11–100), ‘uncommon’ (101–600), and ‘common’ (≥ 600 BRUVS) species in the TFS dataset (A; n = 2349) and tMaxN (B; n = 3384) dataset (see Fig 2A). The boxes show the medians (black lines) and means (red points) within the first and third quartiles of the data. The ‘whiskers’ represent 1.5 times the interquartile ranges, and outliers in events proportions are shown.

