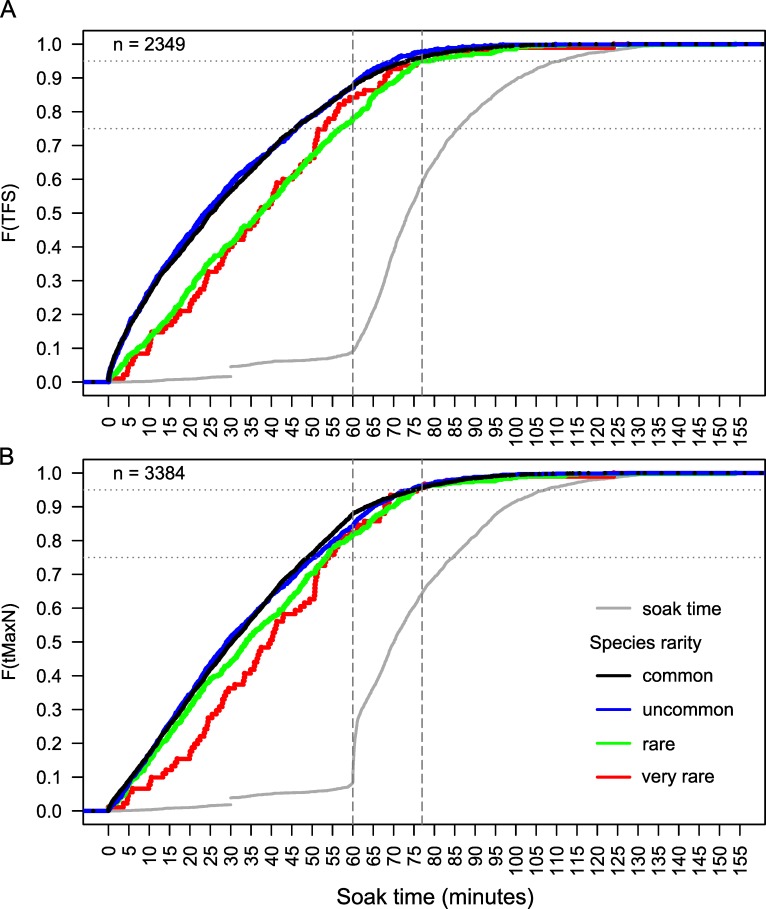
Fig 4. Time to first sighting (TFS: A) and time to maximum MaxN (tMaxN: B) by species rarity group.
Empirical cumulative density functions (ECDF) of the TFS and tMaxN by 4 species groups based on their rarity (see Fig 2A). The ECDF for soak times are also shown for each dataset. Horizontal lines on the y-axis show 75th and 95th percentiles in the ECDF. Vertical lines on the x-axis represents a soak time of 60 and 77 minutes.

