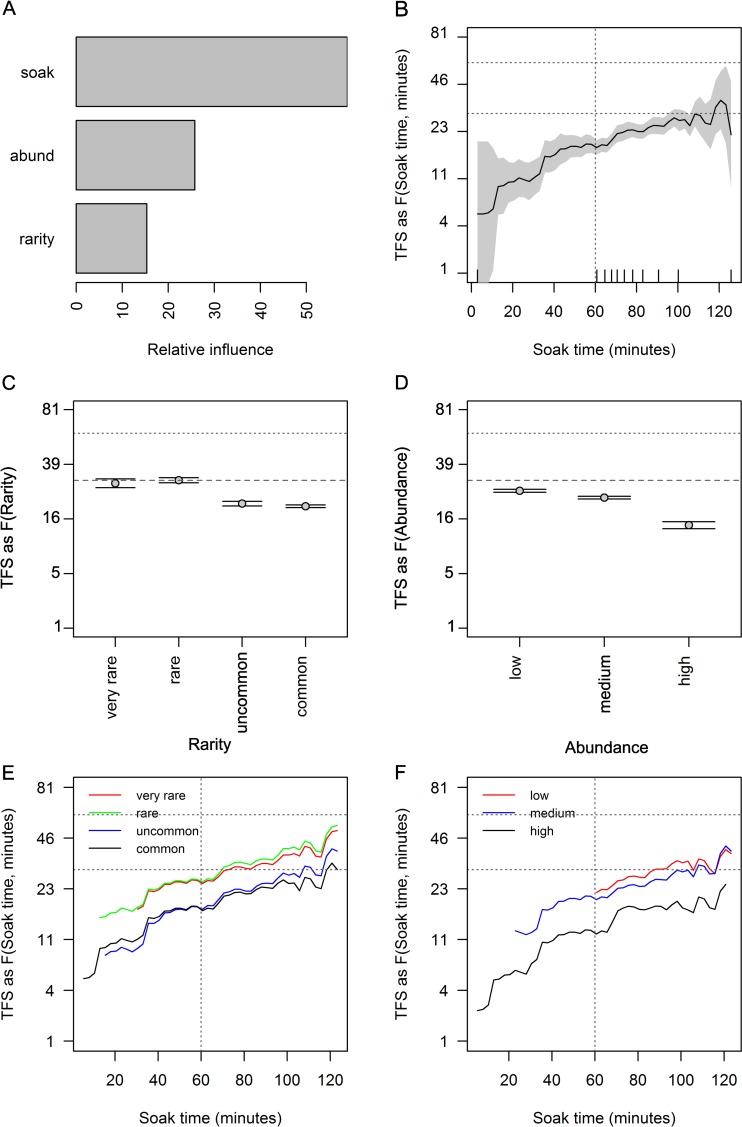
Fig 6. Partial effects plots of soak time, species rarity and abundance groups on TFS.
Relative influence of each predictor (A), the effects of each predictor: soak time (B); species rarity groups (based on occurrence, C); and abundance groups (based on SPUE per BRUVS, D); are shown when the other predictors were held to their average value. The partial effect of soak time given the 4 species rarity groups (E) and 3 abundance groups (F) are indicated. Shading and errors bars are 2 standard errors. The y axes are back-transformed responses from the 4th root scale, expressed in minutes. The rugs on the x-axis of panel (B) are ten percentiles in the distribution of the soak times. Horizontal lines on panels show mean TFS (30.6 minutes) and 60 minutes and vertical lines indicate a soak time of 60 minutes.

