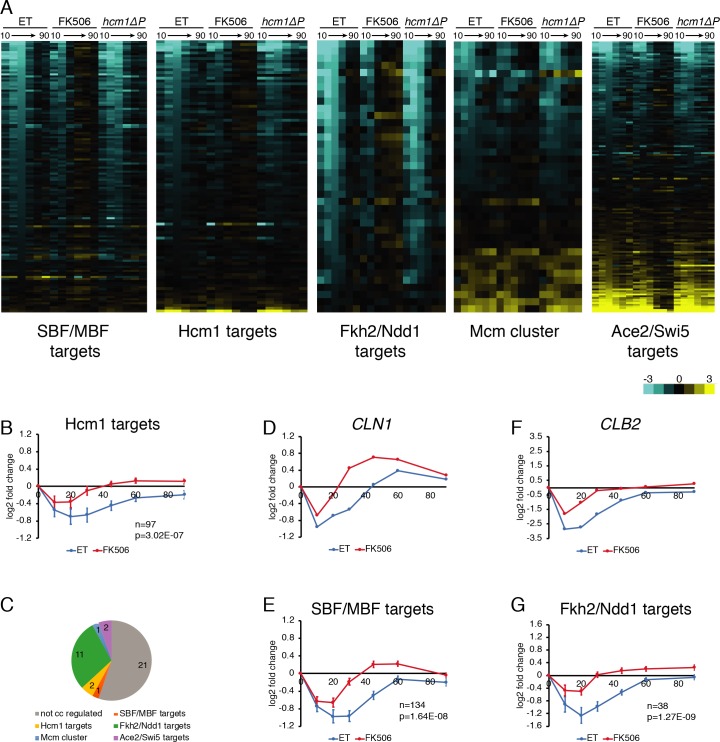
Fig 2. Calcineurin downregulates expression of cell cycle genes.
RNA-seq was performed on duplicate time course experiments in which crz1Δ or crz1Δ hcm1ΔP cells were treated with ET buffer (both gentoypes) or FK506 (crz1Δ only) for 15 minutes before the addition of CaCl2, as in Fig 1A. (A) Heat maps showing log2 fold change in expression of cell cycle-regulated genes compared to each corresponding 0-minute time point. Lists of genes in each cluster and values used to generate heat maps are included in S1 Data. (B) Average expression of all Hcm1 target genes. Error bars indicate the 95% confidence interval. Number of genes (n) and the adjusted p-value indicating the significance of the difference between ET and FK506 curves are included. (C) Genes whose expression are significantly different between ET and FK506-treated crz1Δ cells after 10 minutes of CaCl2 treatment. 17 of 38 genes (colored segments) are cell cycle regulated genes. See S1 Table for list of genes. (D) Expression of the SBF/MBF target CLN1 from RNA-seq data. (E) Average expression of all SBF/MBF target genes. Error bars indicate the 95% confidence interval. Number of genes (n) and the adjusted p-value indicating the significance of the difference between ET and FK506 curves are included. See S3 Fig for subsets of SBF/MBF targets. (F) Expression of the Fkh2/Ndd1 target CLB2 from RNA-seq data. (G) Average expression of all Fkh2/Ndd1 target genes. Error bars indicate the 95% confidence interval. Number of genes (n) and the adjusted p-value indicating the significance of the difference between ET and FK506 curves are included.

