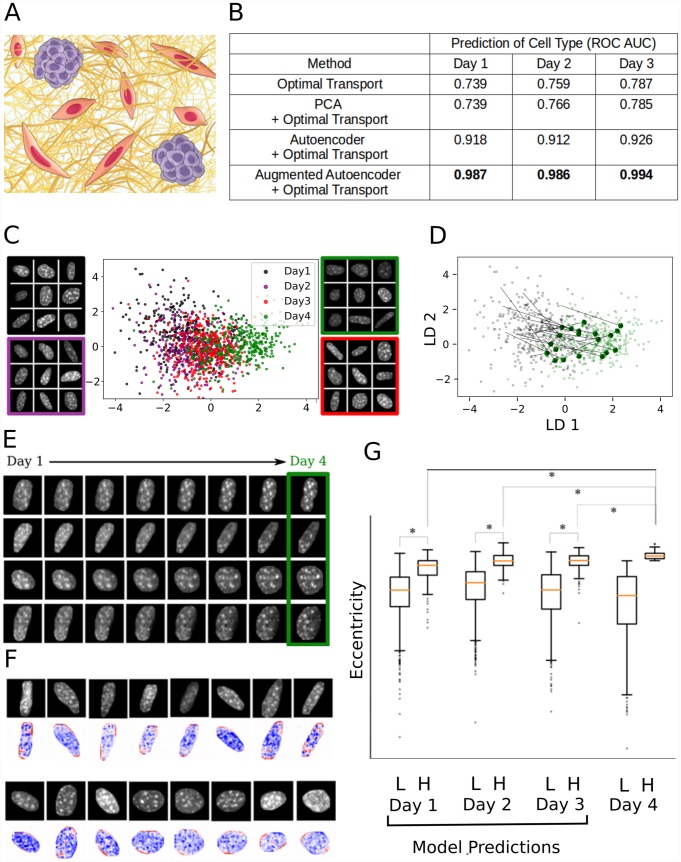
Fig 2. ImageAEOT applied to lineage tracing of single-cell imaging data from a fibroblast-tumor coculture system.
(A) Schematic of the fibroblast-tumor coculture experiment. NIH3T3 fibroblasts were cocultured with MCF7 cells for 1 to 4 days. The cells were subsequently fixed, DAPI stained, and imaged. (B) Comparison of ImageAEOT using a standard autoencoder (AE+OT) and an augmented autoencoder (augAE+OT) against Waddington-OT (OT, PCA+OT) on the proposed benchmark task. The evaluation metric shown is the area under the receiver operating characteristic curve (ROC-AUC) of the inferred probabilistic labels (score between 0 and 1, higher is better). ImageAEOT achieves considerable quantitative gains over the baseline. (C) Visualization of NIH3T3 nuclei from Days 1-4 in both the original image space and the feature space using a Linear Discriminant Analysis (LDA) plot. The x-axis and y-axis are respectively the first and second linear discriminants applied to the data. The first two linear discriminants capture the smooth progression of the cells from Day 1 through Day 4. Day 1: black; Day 2: purple; Day 3: red; Day 4: green. (D) Predicted trajectories in the feature space using optimal transport, plotted on the same set of axes as in (C). ImageAEOT was used to trace the trajectories of Day 4 NIH3T3 nuclei back to Day 1 NIH3T3 nuclei. Each black arrow is an example of such a trajectory. (E) Predicted trajectories mapped back to the image space. Note that only the last image in each sequence is a real Day 4 NIH3T3 nucleus. All other images are predicted and generated by ImageAEOT. (F) Interpretation of feature space by perturbing cell features and decoding the results to the image space. The top row shows nuclear images from Day 1 NIH3T3 fibroblasts. The image shown below each top row image is the predicted change in the image if we were to shift it towards the distribution of Day 4 images in the feature space, along the first linear discriminant shown in (C) (blue: decrease in pixel intensity; red: increase in pixel intensity). These results suggest that the elongated nuclei become more elongated (i.e. increase of intensity at the poles) and the more spherical nuclei remain more spherical as the fibroblasts progress from Day 1 to Day 4 during their activation. In addition, fibroblast activation is accompanied by chromatin decondensation as revealed by the decrease in pixel intensities. (G) NIH3T3 nuclei were divided into two sub-populations on Day 4 based on nuclear elongation (L: low eccentricity, H: high eccentricity) and ImageAEOT was used to generate pseudo-lineages of these sub-populations on Days 1-3. The box-plots show the distribution of elongation of the Day 4 cells as well as model predictions on Days 1-3. The model predictions suggest that the elongated sub-population on Day 4 is already detectable on Day 1, i.e., a subset of the Day 1 population is already primed for activation.

