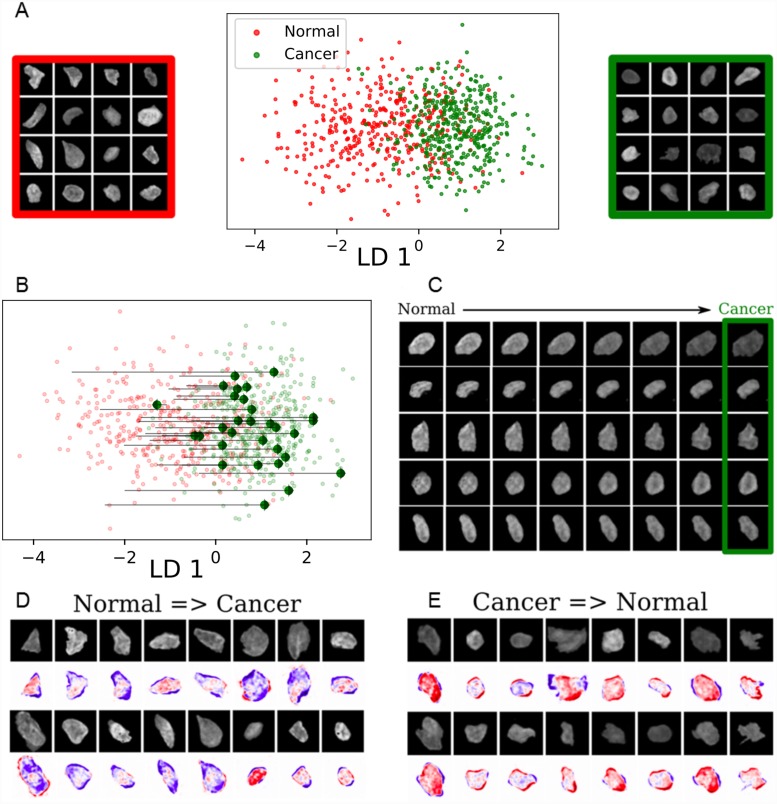
Fig 4. ImageAEOT applied to tracing cellular trajectories in breast tissues.
(A) Visualization of normal and cancer nuclear images from tissue in both the original image space and the feature space using a Linear Discriminant Analysis (LDA) plot. The x-axis shows the first linear discriminant applied to the data. (B) Predicted trajectories in the feature space using optimal transport, shown on the same axes as in (A). ImageAEOT was used to trace the trajectories from normal to cancer nuclei. (C) Predicted trajectories mapped back to the image space. Note that only the last image in each sequence is a real nucleus; the remaining images are predicted and generated by ImageAEOT. (D-E) Illustration of the principal features that change between normal and cancer nuclei, namely a combination of nuclear morphological and chromatin condensation features.

