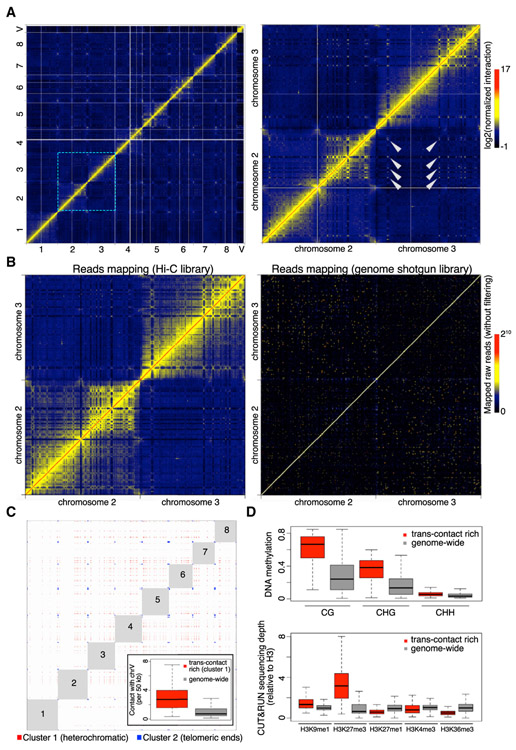
Figure 6. Marchantia Genome Shows Extensive Inter-chromosomal Interactions.
(A) Normalized Hi-C map at 50 kb resolution. The right panel shows the zoom-in image of an area containing chromosomes 2 and 3, in which selected trans-contacts among interstitial regions in different chromosomes are highlighted with arrowheads.
(B) Comparison of chromatin interaction maps (50-kb bin) generated with comparable amounts of mapped reads in Hi-C and genome shotgun libraries (110 versus 130 million), respectively. The pair-end genome shotgun library is a combination of SRA: SRR396657 and SRR396658 [10] and was mapped to the assembled TAK-1 genome as Hi-C reads. Note that the diagonal of the plot shown on the right has values larger than the maximum defined in the color bar.
(C) Genomic regions showing strong and extensive trans-interactions. Bins having at least one top 0.5% inter-chromosomal contacts in the normalized Hi-C map shown in (A) were subjected to k-means clustering based on their genome-wide inter-chromosomal contact patterns. The optimal number of clusters was determined as 3 based on the Elbow method. For the first two clusters, virtual interactions among members of each cluster are shown as red and blue dots, respectively, representing an ideal situation in which all possible contacts happen within each cluster and are visible on a Hi-C map. Numbers depict autosome names. The inset shows inter-chromosomal contacts between autosomes and the V chromosome.
(D) DNA methylation (top panel) and histone modifications (bottom panel) in genomic regions annotated as “cluster 1” in (C) and the whole genome (V chromosome not included). The DNA methylation data of Tak-1 thalli was from [32].

