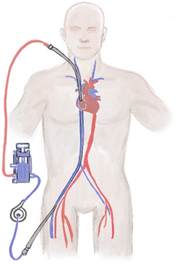
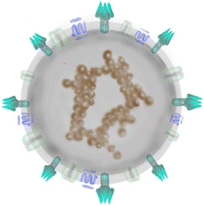
Table 1.
Comparison of hematological and biochemical parameters in V-V ECMO and SARS-CoV-2 induced ARDS
|
V-V ECMO
|
SARS-CoV-2 ARDS
|
|
| Hematological findings | ||
| White blood cell count | Initial ↑ | ↑ |
| Lymphocyte | ↓ | ↓↓ |
| Neutrophil | Initial ↑ | ↑ |
| Neutrophil activation | Initial ↑ | ? |
| Monocyte | Initial ↑ | ∽ |
| CD3+, CD4+, CD8+, T cells | ↓ | ↓↓ |
| Natural killer cells | ↓ | ∽ ↓ |
| Neutrophil to lymphocyte ratio | ↑ | ↑ |
| Hemoglobin and red blood cell count | ↓ | ∽ |
| Platelet count | ↓ | ↓∽ |
| Coagulation and anticoagulation | ||
| Platelet activation | ↑ | ? |
| Platelet aggregation | ↓ | ? |
| Platelet activation factor | ↑ | ? |
| Heparin-induced thrombocytopenia | ↑ | ? |
| Von Willebrand factor | ↓ | ? |
| D-dimer | ↑ | ↑↑ |
| Fibrin degradation products | ↑↑ | |
| Activated partial thromboplastin time | ↑ | ∽ |
| Prothrombin time | ∽ | |
| Thrombospondin | ↓ | ? |
| Fibronectin | ↓ | ? |
| Thrombin | ↑ | ? |
| Fibrinogen | Initial ↓ | ↑ |
| High molecular weight kininogen | ↑ | ? |
| Prekallikrein | ↓ | ? |
| Kallikrein | ↑ | ? |
| FVIII | ↓ | ? |
| FX | ↑ | ? |
| FXI | ↓ | ? |
| FXIa | ↑ | ? |
| FXII | ↓ | ? |
| FXIIa | Rapid ↑ | ? |
| FXIII | ↓ | ? |
| Antithrombin | Initially ↓ (UFH) | ↓ |
| C-protein | ↑↓ | ? |
| Activated clotting time | ↑ | ? |
| R-time thromboelastography | ↑ | ? |
| Inflammatory response | ||
| Tissue factor | ↑∽ | ? |
| Bradykinin | ↑ | ? |
| TNF-alpha | ↑ | ∽↑ |
| IFN-gamma | ? | ↑ (4–6 days after presentation) |
| IL-1-beta | ↑ | ↓↓ |
| IL-2 | ? |
↑ 4–6 days after presentation |
| IL-2R | ? | ↑ |
| IL-4 | ? | ∽ |
| IL-6 | ↑ | ↑↑ |
| IL-8 | ↑ | ? |
| IL-10 | ↑ | ↑ |
| IgE | ↓ | ? |
| IgA | ? | ∽ |
| IgG | ? | ∽↑ |
| IgM | ? | ∽ |
| Complement | ∽↑ | ∽ |
UFH unfractionated heparin
The references to support the above table are listed as supplementary S1-S82


