
Figure 1.
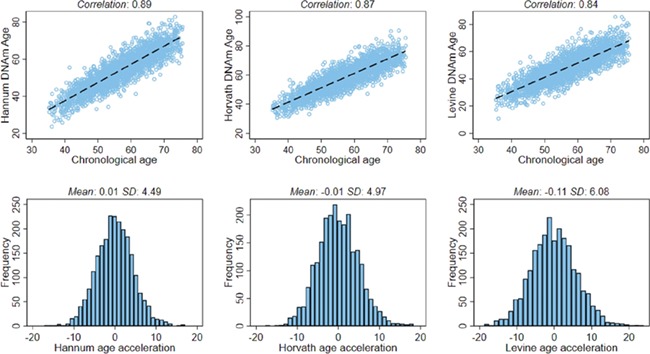
Scatter plots between chronological age and DNAm age estimated using the three epigenetic clocks and distributions of the three age acceleration metrics. The scatter plots (top row) show the Pearson correlations. The distributions of the age acceleration metrics (bottom row) include the mean and SD.