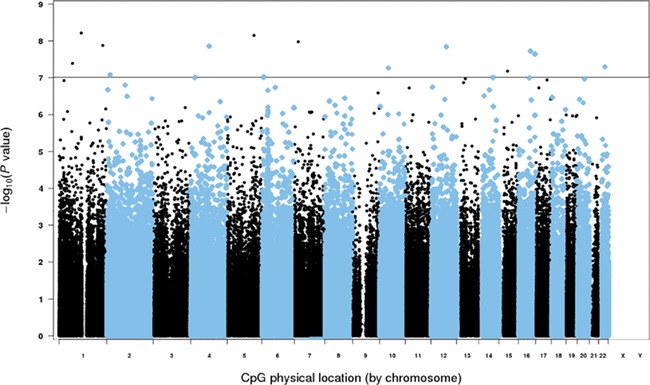
Figure 3.

Manhattan plot for the epigenome-wide association of parity. The data account for relative teenage weight compared to peers (lighter, about same, heavier) and early adulthood smoking (pack yrs.) and alcohol use (drinks/wk.). There were 17 significant CpG sites, using a Bonferroni-corrected P ≤ 1.0 × 10⁻⁷ (solid black line).
