
Fig 12:
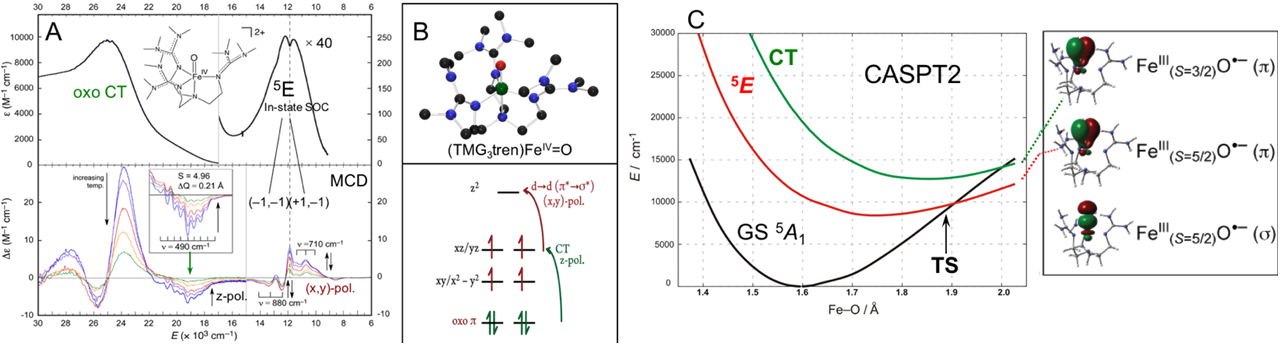
A) Abs (top) and VT MCD (bottom) data on S = 2 (TMG3tren)FeIV=O. B) Geometry optimized computational model (top) and MO diagram showing the origin of the d → d and CT transitions observed in Abs and MCD spectroscopy on (TMG3tren)FeIV=O. C) Potential energy surface of S = 2 (TMG3tren)FeIV=O states along the Fe-O coordinate which reveal one σ and two π FMOs with oxyl-FeIII character at the TS (at right). Adapted from Ref 38.