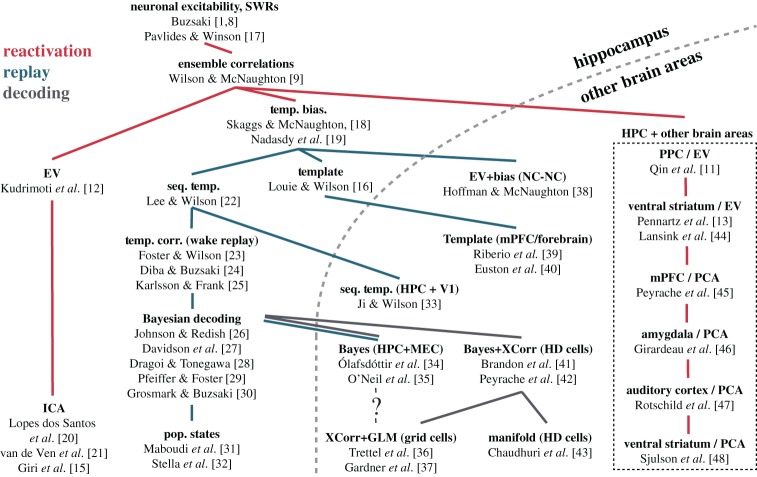
Figure 1.
Phylogeny of method development. We have attempted to trace out when new methods were developed, and what phenomenon (reactivation or replay) they quantify. Red traces indicate phylogenetic branches of reactivation method development. Blue traces indicate branches of replay method development. Grey traces indicate branches using ‘decoding’ methods. Abbreviations: Bayes, Bayesian decoding; EV/REV, explained variance/reverse explained variance; GLM, generalized linear models; HPC, hippocampus; mPFC, medial prefrontal cortex; NC, neocortex; PoP States, population states; PPC, posterior parietal cortex; Seq. Temp., sequence template; Temp. Bias, temporal bias; V1, primary visual cortex; XCorr, cross-correlation. (Online version in colour.)

