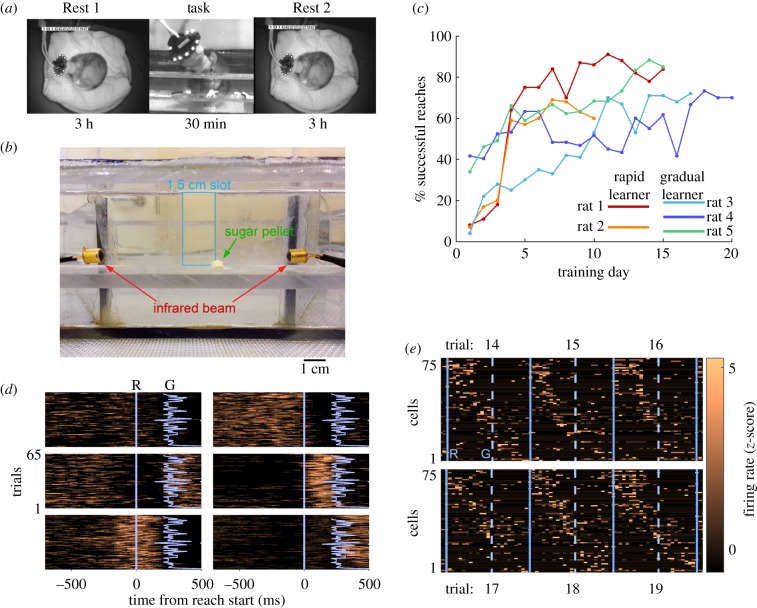
Figure 1.
Behaviour and motor cortex cell firing during reaching. (a) Daily recording procedure. (b) Front view of reaching cage. (c) Performance on the single-pellet reaching task. (d) Example raster plots of six cells showing diverse firing patterns during reaches. Blue lines indicate start of reach (R) and grasp (G) times. (e) Six successive reach trials illustrating variability in sequential firing pattern of single units. Solid blue lines indicate trial boundary (start of reach), and dashed lines indicate grasp time. Trial duration is 1200 ms. (Online version in colour.)

