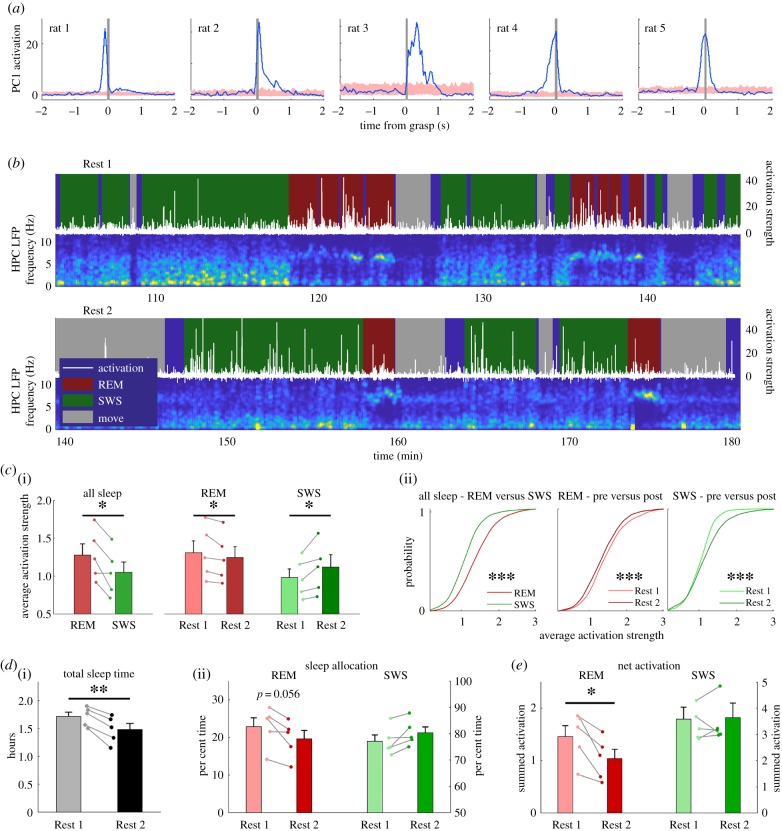
Figure 3.
PCs of reaching activity are activated during REM and SWS. (a) Reach-triggered average of PC activation shows PC1 is related to reach behaviour. Shaded region is mean ± s.e.m. of randomly sampled time points in task. (b) Example time course of PC activation in Rest 1 and 2 against the background hippocampal LFP spectrogram. HNPC, hippocampus; LFP, local field potential. (c(i)) Group average (n = 5 rats) of activation strength from sleep from all training days. REM activation is stronger than SWS activation (t4 = 3.5, p < 0.05). REM activation is stronger in Rest 1 (t4 = 2.8, p < 0.05), and SWS activation is stronger in Rest 2 (t4 = 2.8, p < 0.05). (c(ii)) Distributions of activation strength in individual REM and SWS epochs pooled from all animals and all training days (***p < 0.001, Kolmogorov–Smirnov test). (d(i)) Rats slept more in Rest 1 than Rest 2 (t4 = 6.7, p < 0.01). (d(ii)) There was strong tendency for a greater allocation of REM sleep in Rest 1 (t4 = 2.65, p = 0.056). (e) The net REM activation was significantly greater in Rest 1 (t4 = 4.4, p < 0.05), whereas the net SWS activation was similar in Rest 1 and Rest 2. (Online version in colour.)

