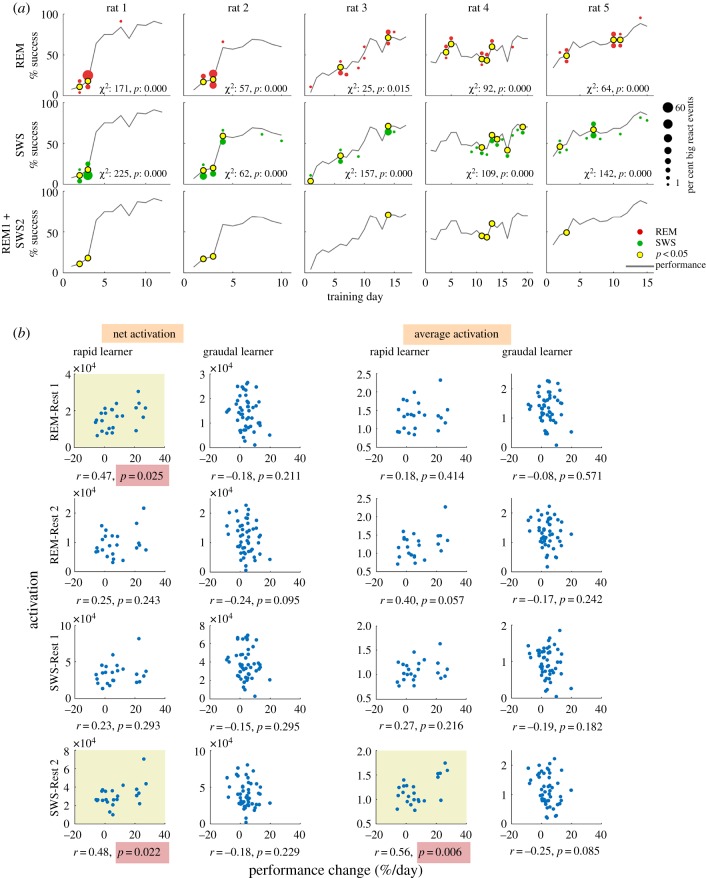
Figure 4.
PC activation during rest is related to rapid skill learning. (a) Distribution of big-REM and big-SWS epochs across training days. Red and green dot size indicates the percentage of big-REM and big-SWS, respectively; dots above the performance curve are Rest 1, below is Rest 2. χ2 statistic indicates significant non-uniform distribution of big epochs across days and yellow dots indicate days for which the observed number of big epochs was greater than expected by chance. Bottom row indicates days with significant joint occurrence of big-REM and big-SWS; for rapid learners, significant joint activation of REM and SWS occurred just prior to large performance gains. (b) Correlation of PC activation in REM or SWS and daily change in performance in rapid and gradual learners. The amount of activation (either net or average) is plotted against the daily change in performance (Day (n) to Day (n + 1)). The net activation is the sum of activation and average is the net activation divided by time. Yellow background indicates significant Pearson correlation. (Online version in colour.)

