Figure 7.
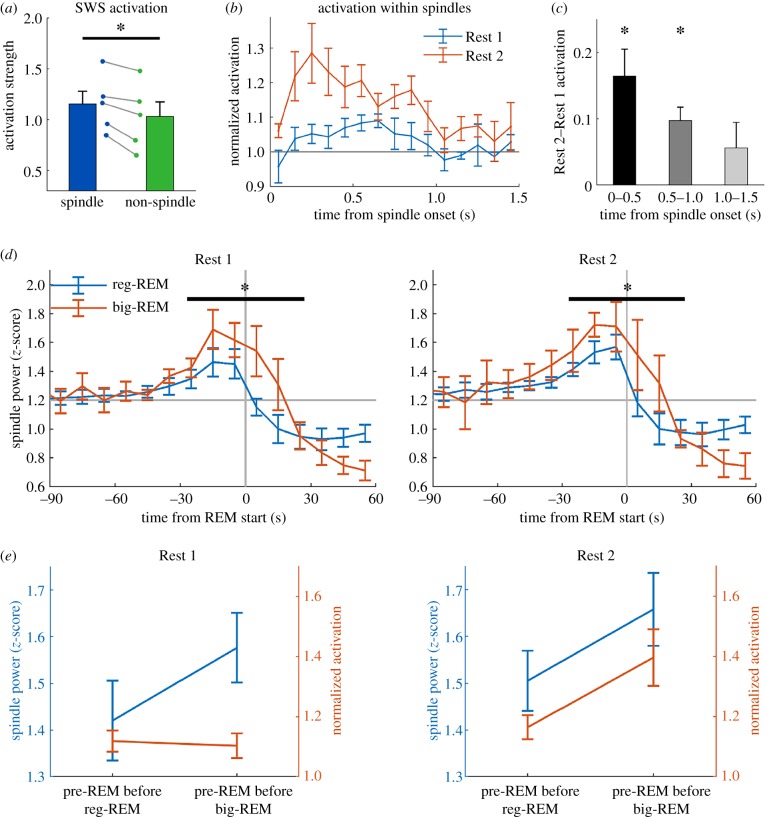
PC activation in SWS occurs preferentially at the start of sleep spindles. (a) Activation strength is significantly stronger in spindles compared to non-spindle SWS (t4 = 4.9, p < 0.01). (b) Time course of activation within spindles in Rest 1 and 2. For each spindle, activation was binned into 100 ms bins for the duration of the spindle. If the spindle duration was less than 1500 ms, unfilled bins were assigned NaNs (‘not-a-number’) and excluded from the average. Activation is normalized to 1000–1500 ms in Rest 1, and error bars are s.e.m. of five rats. (c) When averaged into 500 ms bins, Rest 2 activation was significantly stronger up to 1000 ms, but not thereafter (p < 0.05, Bonferroni-corrected). (d) Pre-REM spindle power increases prior to reg-REM epochs, but the increase prior to big-REM is significantly greater compared to reg-REM for Rest 1 (ANOVA F1,4 = 19.8, p < 0.05) and Rest 2 (ANOVA F1,4 = 17.0, p < 0.05). (e) Summary figure showing pre-REM spindle power and pre-REM activation strength. In Rest 1, activation does not increase with spindle power, but does increase with spindle power in Rest 2. (Online version in colour.)

