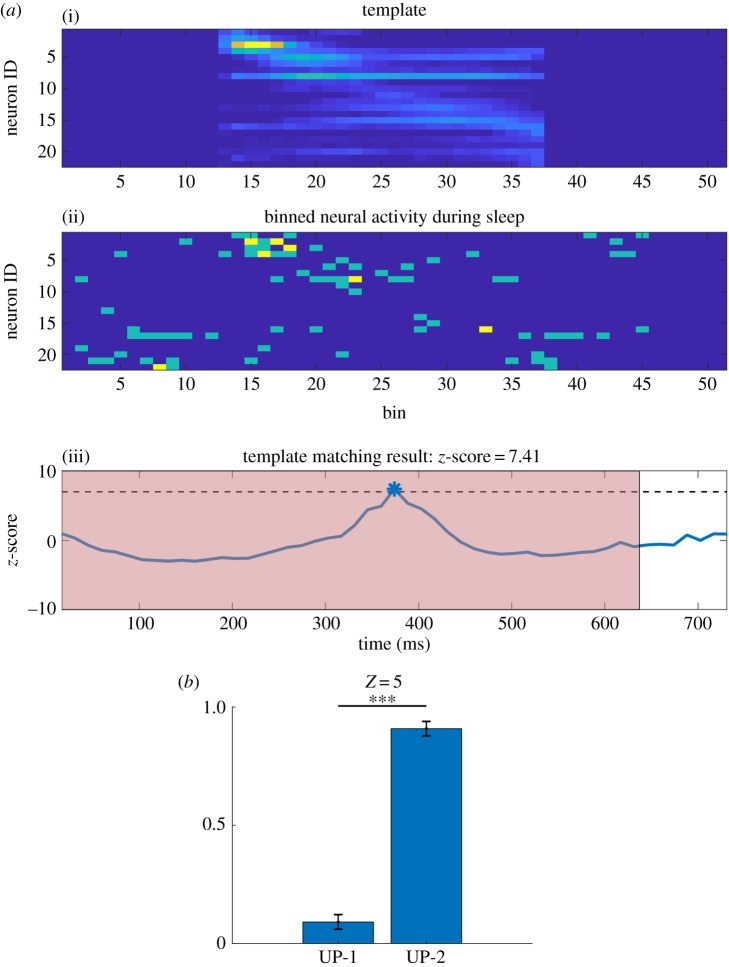
Figure 3.
Template matching. (a) Example of the template matching algorithm. (i) The template obtained by averaging neural activity of one segment of the sequence during task 2 of one recording session from an animal. (ii) A snapshot of neural activity during rest 3. The template was binned using a 100 ms bin. The neural activity during rest 3 was binned using a 14.3 ms (approx. 100/7 ms) bin, representing a match using a 7× compression rate in this example. Compression rates between 1× and 10× were explored and the one that had the most z-scored correlation peak values above 5 was selected as the best compression rate. The corresponding z-scored correlation values are shown in (iii). Dashed line depicts a threshold of 7 and the peak is used to mark the moment of best match, which is taken as the time when replay occurred. The red patch depicts UP-2. (b) Ratio of number of replay events found in UP-1 and UP-2. Replay events exceeding z-score value of 5 were used. (***p < 0.001).

