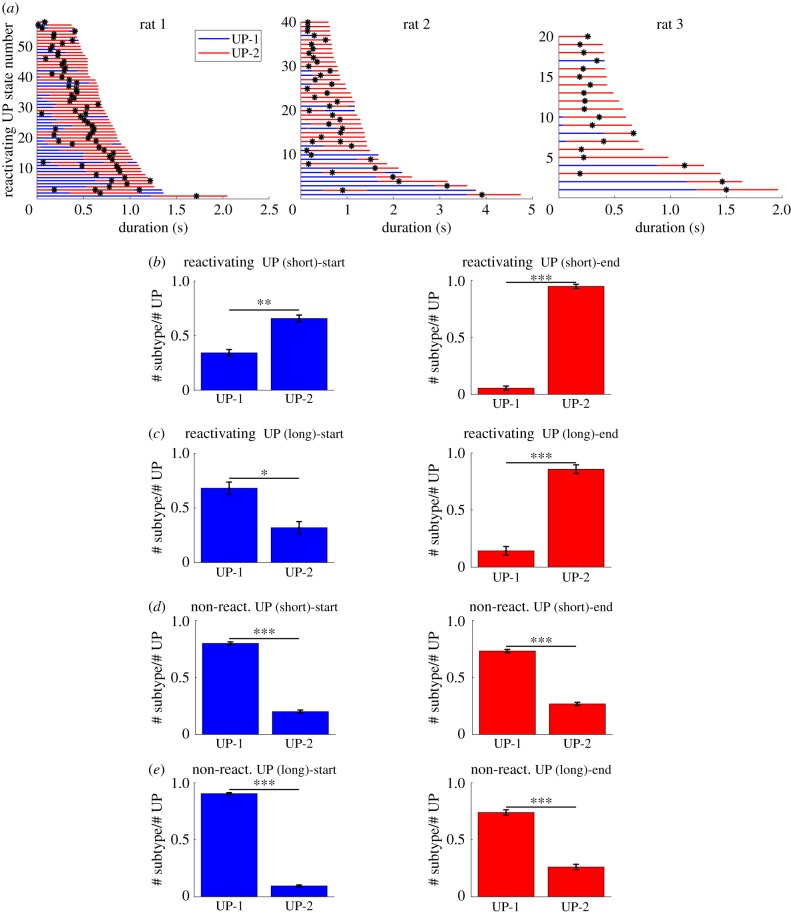
Figure 4.
Start and end analysis of UP states. (a) All reactivating UP states from three datasets from different animals were sorted by their duration. Blue and red portions represent UP-1 and UP-2 states, respectively. Shorter UP states tend to be dominated by the UP-2 whereas longer UP states tend to start with the UP-1 and end with the UP-2. The black ticks represent the time of the template matching peaks. (b) Quantification of the start and end of UP states over 10 datasets. UP states were divided into short and long ones using thresholds between 580 and 1250 ms (*p < 0.05, **p < 0.01, ***p < 0.001). (left) The start of short reactivating UP states. (right) The end of short reactivating UP states. (c) (left) The start of long reactivating UP states. (right) The end of long reactivating UP states. (d,e) The same measures as (b) and (c) but for UP states without reactivation. (Online version in colour.)

