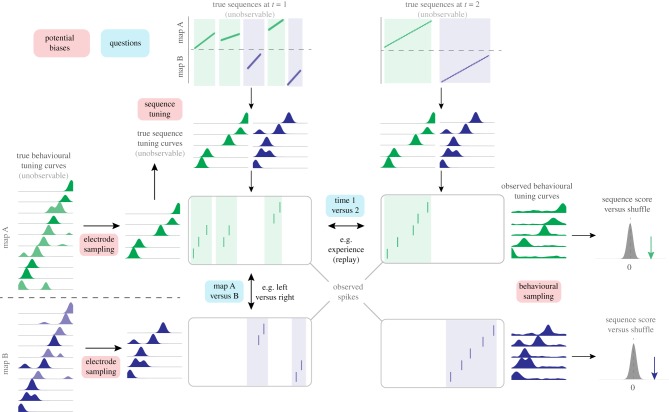
Figure 2.
Framework for identifying issues in second-order sequence analysis. Underlying ‘true’ sequences (top, shown here as linear changes in position over time, though nonlinear changes can be similarly represented) occur on either of two maps (A, green shading; B, blue shading). These are unobservable ‘ground truth’ sequences that the data analysis seeks to recover. True sequences are postulated to generate observable spiking activity (shown in the rasterplots) through sequence tuning curves, which relate an internal position signal to firing rate, and are also not directly observable. True sequence content may differ between time points (t = 1 shown in the left column versus t = 2 shown on the right) and between maps (A versus B). Such analyses are inherently restricted because they sample neural activity from a finite number of cells (electrode sampling, left), and sample behavioural tuning curves (firing rate as a function of position, used to determine the sequence template) based on finite behavioural data (behavioural sampling, illustrated by the noisy tuning curves on the right). Sequence tuning curves, electrode sampling and behavioural sampling may all differ between time points and/or maps, potentially resulting in biases in resulting sequence scores. (Online version in colour.)

