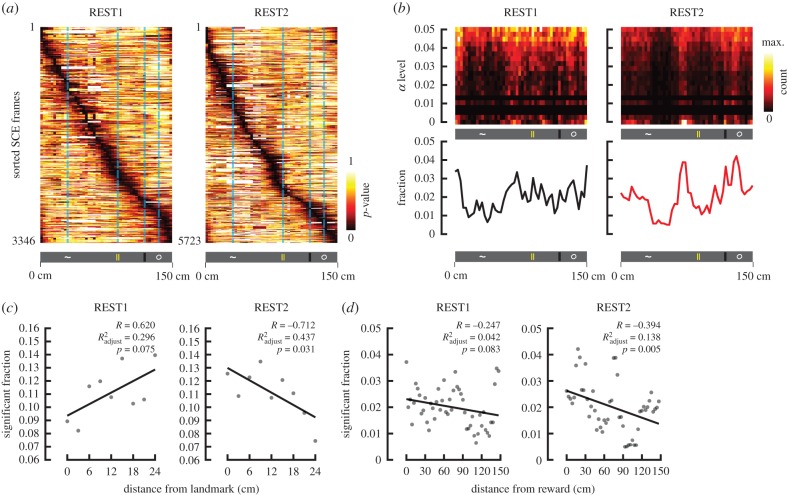
Figure 6.
REST2 ensemble co-activation decodes positions near landmarks and reward. (a) For each time frame associated with an SCE, p-values were obtained as the fraction of probabilities obtained from shuffling that were greater than the probabilities obtained from the true data, at every given position. In other words, we evaluated the degree to which a decoded position during an SCE is likely due to chance (the lower the p-value, the less likely the decoding was obtained by chance). These time frames were sorted according to the location of most significant decoding. Results from all SCE-associated time frames (obtained from all three animals, all 13 sessions) are shown for REST1 and REST2. (b) Joint density distributions of the fraction of significantly decoded positions at different α levels (p-values). α levels were binned over a logarithmic scale. The fractions of significant decoding (p < 0.05; analogous to summing over the columns) as a function of position is shown below. Notice in REST1, the fractions are more uniformly distributed, while in REST2, the fractions are more concentrated near the locations of landmarks. (c) The fraction of frames that significantly decoded position (p < 0.05) is compared with the distance from the closest landmark over a scatter plot. Since the landmarks were not separated uniformly over the same distance, the fractions were normalized by the occupancy over each spatial bin. Linear regression fit line depicted in black. (d) Same as (c), but evaluating the distance needed to be travelled before receiving reward.

