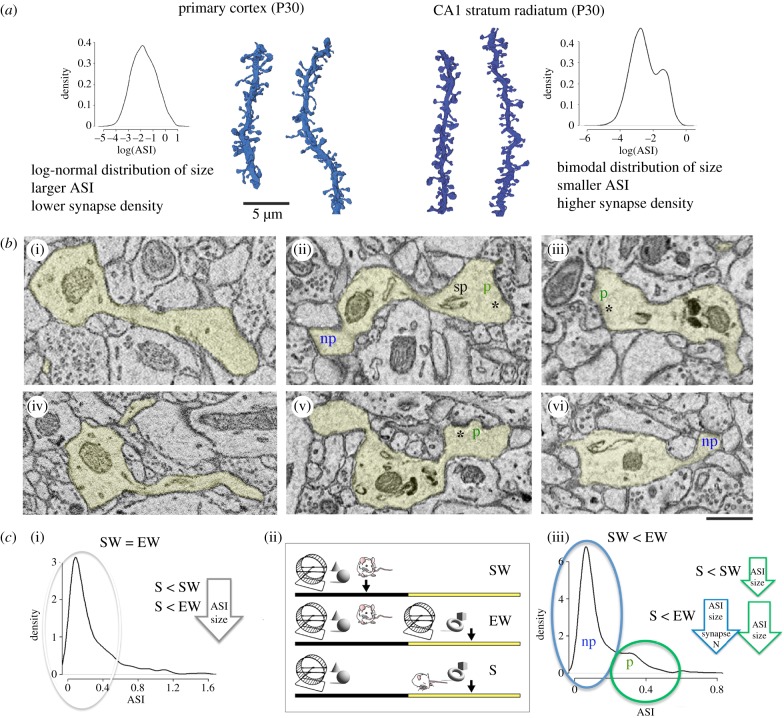
Figure 3.
(a) Examples of dendritic segments from primary cortex (left, lighter blue, S group) and CA1 (right, darker blue, S group) and lists of some of their structural differences. Probability densities (log-transformed) reveal a log-normal distribution of ASI size in cortex and a bimodal distribution in CA1. Results are described in detail in the original publications: primary cortex P30 [11]; CA1 stratum radiatum P30 [32]. (b) Two-dimensional images of cortical synapses ((i) and (iv)) and CA1 synapses ((ii), (v) and (iii),(vi)). (ii), (v) and (iii),(vi) show the two types of CA1 synapses, non-perforated (np, in blue) and perforated (p, in green), and some of the distinctive features of perforated synapses, including the presence of a spine apparatus (sp) and a discontinuous post-synaptic density (asterisk). Non-perforated synapses have a continuous post-synaptic density. (c) Probability density of ASI size (μm2) in cortex (left) and in CA1 (right) and summary of the results. In primary cortex, the decrease in ASI size after sleep is size-dependent: it occurs in small and medium synapses (grey circle and arrow), which represent approximately 80% of synapses, but spares the largest synapses. In CA1, the perforated synapses (green circle and arrows) show smaller ASI size after sleep (S) relative to spontaneous waking (SW) as well as after S relative to extended waking (EW). Non-perforated synapses (blue circle and arrow) show smaller ASI size after S relative to EW (but not relative to SW). Synapse density shows a trend to decrease in S relative to EW (p = 0.0832; details in [32].) The three experimental conditions are depicted in the (ii) (SW, EW and S) and are the same in the two studies.

