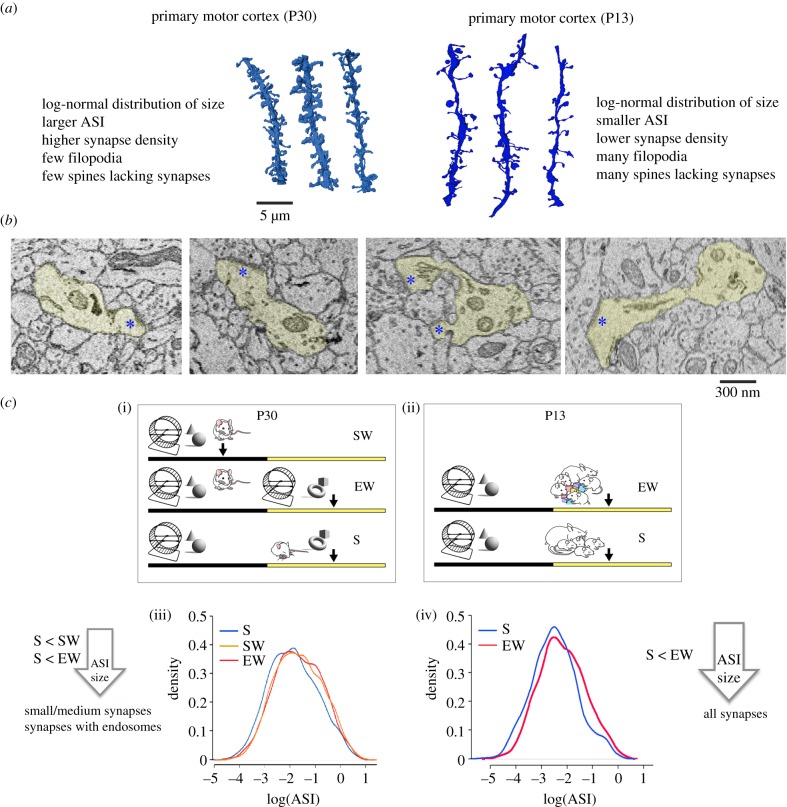
Figure 4.
(a) Examples of dendritic segments from primary motor cortex (M1) in P30 mice (left, lighter blue, S group) and in P13 pups (right, darker blue, S group) and lists of some of their structural differences. Results are described in detail in the original publications: primary motor cortex P30 [11]; primary motor cortex P13 [19]. (b) 2D images of M1 synapses in P13 pups (layer 2). Blue asterisks indicate the post-synaptic density. (c) Summary of the results in M1 cortex in P30 mice (left) and P13 pups (right). (i) and (ii) show the experimental groups used in the two studies: SW, spontaneous waking; EW, extended waking; S, sleep. The SW group is missing at P13 because pups at this age are never spontaneously awake for several hours. (iii,iv) Probability density of ASI size (log-transformed) at P30 (left) and P13 (right), plotted separately for each experimental group to show the shift to left of the S group. At P30, the decrease in ASI size after S relative to both SW and EW occurs in small and medium synapses and synapses that contain endosomes, but spares the largest synapses. At P13, the decrease in ASI size after S relative to EW occurs in all synapses, independent of their size or the presence of endosomes.

