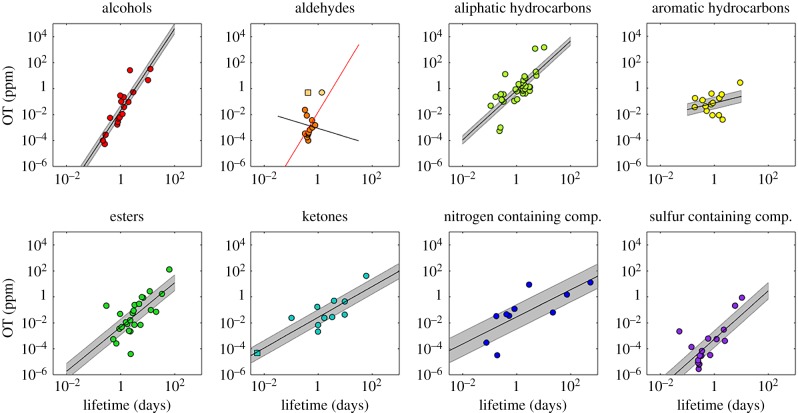
Figure 3.
The odour threshold data from Nagata [14] are plotted against the atmospheric lifetimes of the species with respect to the OH radical. Shaded areas represent 95% confidence regions. The two square markers denote the compounds affected by photolysis: diacetyl in the ketone plot, and formaldehyde in the aldehyde plot. The two alternative fits for aldehydes, based on two formaldehyde lifetimes (uppermost pale yellow square and circle), are discussed in §3b 'Outliers'. (Online version in colour.)

