
Figure 4.
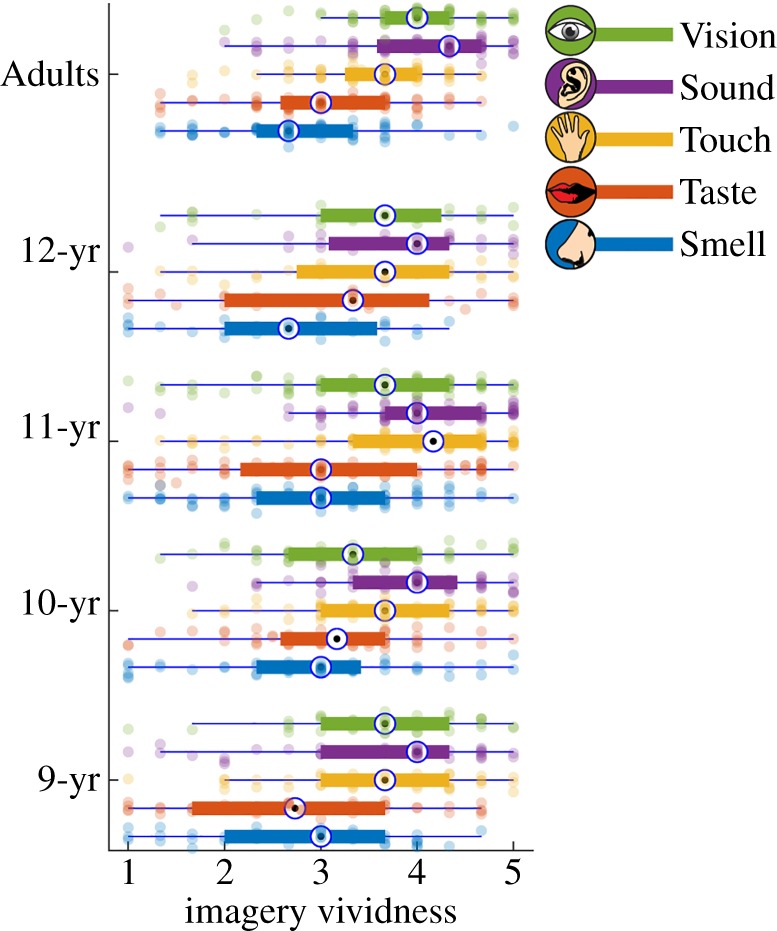
Vividness of mental imagery across age groups, with 1 indicating 'cannot form an image' and 5 indicating 'can form an image as vivid as real life'. Boxes indicate the lower quartile (the left horizontal line), median (bullet circle) and upper quartile (the right horizontal line). Left whiskers indicate the maximum value of the variable located within a distance of 1.5 times the inter-quartile range below the 25th percentile; right whiskers indicate the corresponding distance to the 75th percentile value.