Figure 5.
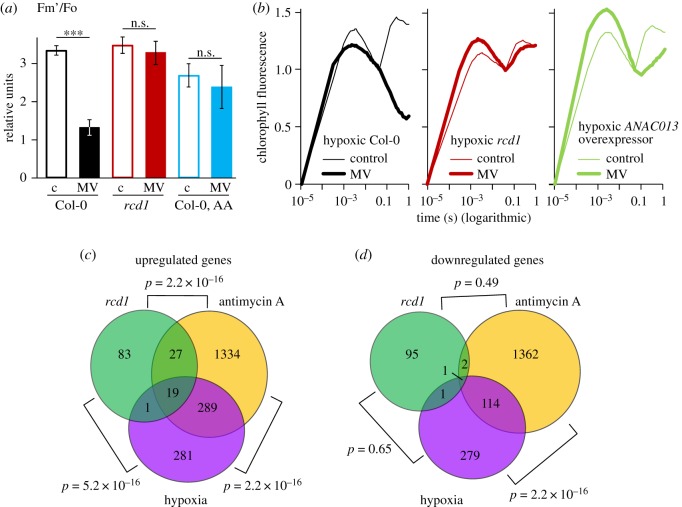
Expression of MDS genes is linked to hypoxic response. (a,b) Response to MV is sensitive to hypoxia in MDS-overexpressing plants other than rcd1. (a) The effect of hypoxia on electron transfer through MV in AA-treated Col-0. Fm’ was obtained as in (figure 4a). Controls untreated with MV are labelled ‘c’. Mean values ± standard deviations are shown. *** P-value < 0.001, one-way ANOVA with Bonferroni corrected post hoc test (N = 3). Full fluorescence kinetics is presented in electronic supplementary material, figure S4. (b) Similarly to rcd1, in ANAC013 overexpressor line PSI–MV electron transfer was suppressed by hypoxia. The OJIP kinetics are double normalized to fluorescence at Fo and Fi (20 µs and 40 ms, accordingly) (N = 3). (c,d) Analysis of publicly available transcriptomic datasets obtained in the rcd1 mutant, in Col-0 plants treated with AA or in Col-0 plants treated with hypoxia. Venn diagrams show the overlap of up- (c) and down-regulated (d) genes. Statistical analysis was performed by a pairwise Fisher's exact test.

