Figure 3.
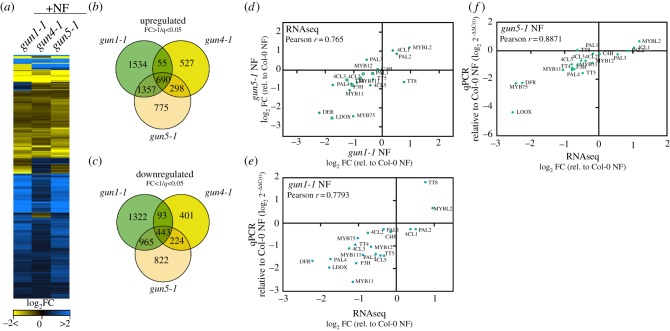
RNA-seq analysis of transcript changes in norflurazon (NF)-treated WT Col-0, gun1-1, gun4-1 and gun5-1 mutants. (a) Heat map representation of significantly deregulated genes (SDGs) for each genotype relative to the WT control (q < 0.05, 0 < log2(fold change) > 0). The RNA-seq experiment was performed, and the results analysed as described in the Materials and methods section. (b,c) Venn diagrams representing the degree of overlap between upregulated (B, fold change > 1) and downregulated (C, fold change < 1) SDGs in the gun mutants. SDGs relative to the WT control were selected based on q < 0.05 (p-value adjusted for the false discovery rate). (d) Comparison of FAB transcript abundance in the gun1-1 and gun5-1 transcriptome datasets. Closed circles denote statistical significance relative to the NF-treated WT (q < 0.05). Abbreviations for genes are explained in figure 1 and in the main text. (f,e) Confirmation of the RNA-seq result by qRT-PCR analysis. Expression of selected transcripts was analysed with cDNA obtained from independent growth of seedlings and was compared to the expression values obtained from the RNA-seq experiments. Gene expression in NF-treated gun mutants was calculated relative to the NF-treated WT and ACTIN2 as reference (ΔΔC(t)method). (d,e) Pearson r > 0.75 indicates a positive correlation between the different datasets and analysis.

