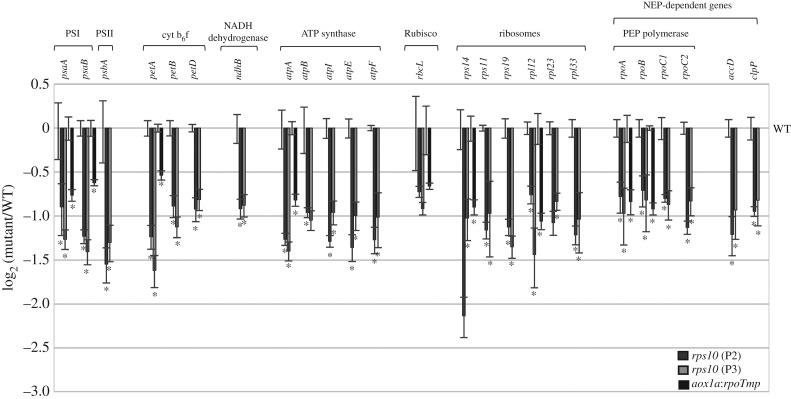
Figure 2.
Steady-state level of plastid transcripts in rps10 and aox1a:rpoTmp compared with wild-type plants. Data are presented as a log2 ratio of the transcript level in the mutants to those in the wild-type. The values obtained were averaged for at least three biological replicates, with error bars representing s.e.m. Statistically significant differences from the wild-type are indicated by asterisks (Student's t test; p ≤ 0.05).

