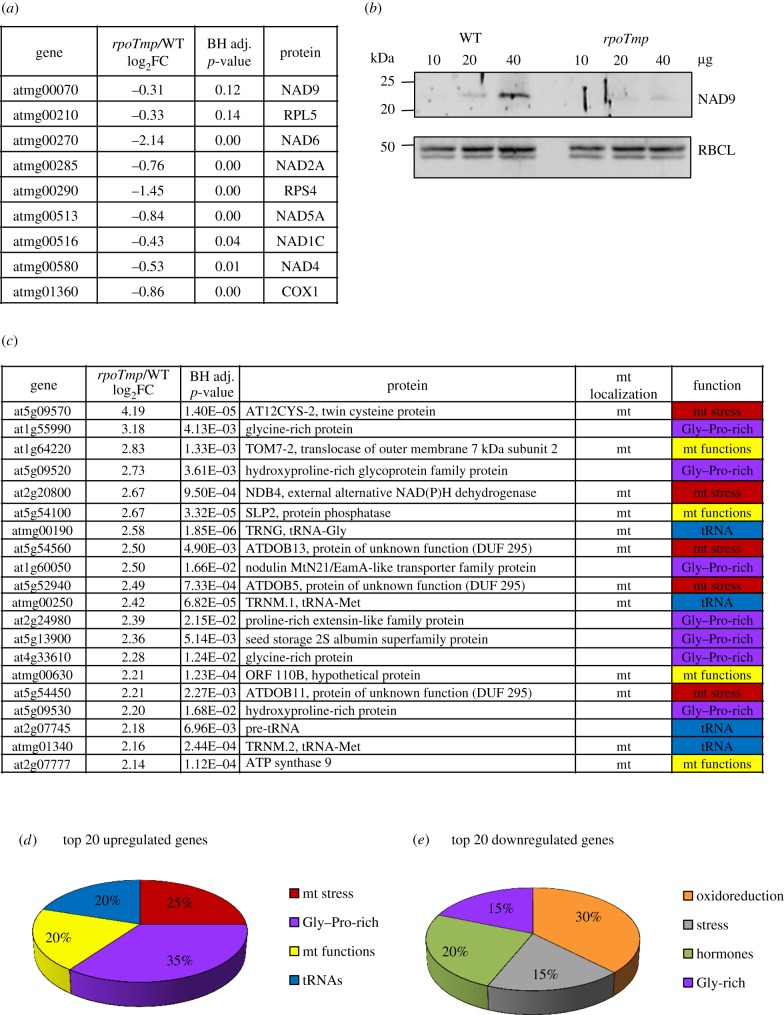
Figure 2.
Relative gene expression profiles of rpoTmp mutants versus WT etiolated plants. (a) The relative expression values for the RPOTmp-dependent subset of mitochondrial genes are indicated in the middle columns together with the corresponding p-values, which are derived from a t-test adjusted for false discovery rate (FDR) using the Benjamini–Hochberg (BH) procedure. Gene identities are indicated in the left, and protein identities in the right columns. Given values represent log2-fold changes (FC). (b) Analysis of accumulation of NAD9 protein used as marker for complex I accumulation. Protein extracts (10, 20 and 40 µg) from etiolated WT and rpoTmp plants were fractionated and immunoblotted with specific antisera against the mitochondrial proteins NAD9 (mitochondrial-encoded) and the plastidial protein RBCL (plastidial-encoded). (c) Relative expression values for the 20 most upregulated genes in rpoTmp plants. Details as in (a). Mitochondrial (mt) localization and protein function are also indicated on the right side of the table. ‘mt stress’ stands for ‘response to mitochondrial stress'. (d) Functional sub-grouping of the 20 most upregulated genes listed in (c). The four groups identified are colour-coded as in (c). For details see text. (e) Functional sub-grouping of the 20 most downregulated genes (electronic supplementary material, table S4). The four groups identified are colour-coded as in (c). The terms ‘hormones’ and ‘stress’ for protein functions stand for ‘response to hormonal stimuli’ and ‘response to stress’, respectively.

