Figure 4.
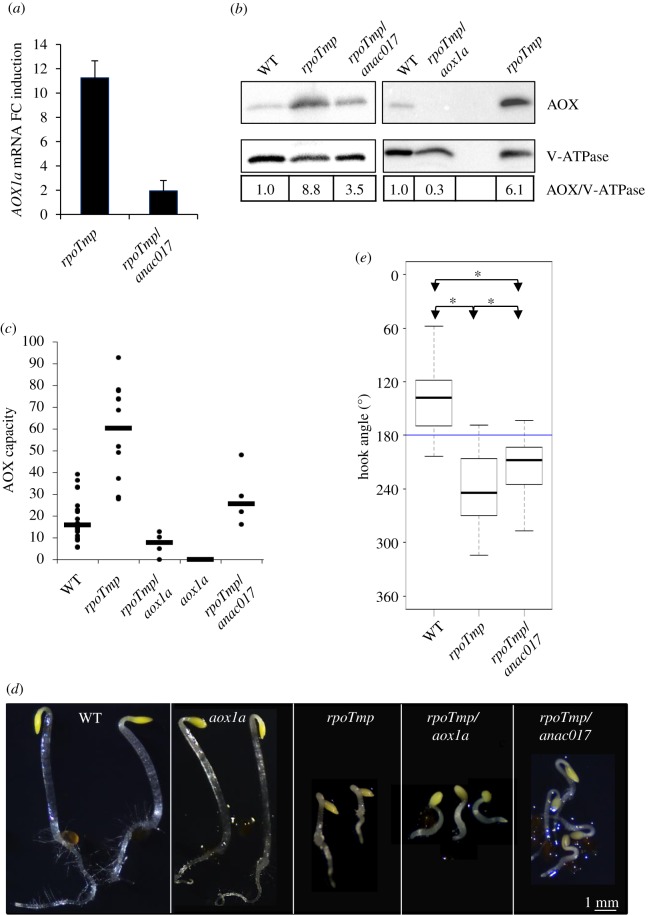
The triple-response-like phenotype in rpoTmp mutant plants requires AOX1a. (a) Linear fold change (FC) induction of AOX1a mRNAs in mutant rpoTmp and rpoTmp/anac017 plants versus WT determined by RT-qPCR. The AOX1a expression levels were normalized with the mean of ACTIN2-8 expression, used as reference gene. The mean values of two biological replicates are plotted. Error bars correspond to standard errors. (b) Protein extracts from etiolated WT, rpoTmp, rpoTmp/anac017 plants (left panel) and WT, rpoTmp/aox1A, rpoTmp plants (right panel) were fractionated and immunoblotted with specific antisera against the mitochondrial AOX isoforms and the vacuolar protein V-ATPase as loading control. Linear fold change variation of AOX protein levels in mutant rpoTmp plants versus WT using V-ATPase for normalization is shown in the bottom panel. (c) Capacity of the AOX-dependent pathway in etiolated mutant plants. AOX capacity was calculated upon addition of 1 mM KCN (final concentration) into the measurement cell. The figure presents the ratio (as a percentage) of the KCN-insensitive O2 consumption rate to the total consumption rate. Median values (thick horizontal lines) of N independent measurements (filled circles) are scatter-plotted for WT (N = 19), rpoTmp (N = 12), rpoTmp/aox1a (N = 5), aox1a (N = 4) and rpoTmp/anac017 plants (N = 4). (d) Images of etiolated plants—WT, aox1a, rpoTmp, rpoTmp/aox1a, rpoTmp/anac017—were taken under a dissection microscope. Scale bar corresponds to 1 mm. (e) Median values of apical hook angle measurements are box-plotted for WT, mutant rpoTmp and rpoTmp/anac017 plants. Values were measured in two independent analyses. N = 53 for WT plants; N = 57 for rpoTmp plants; N = 57 for rpoTmp/anac017 plants. Details of box-plot representation are as given for figure 1b. (Online version in colour.)

