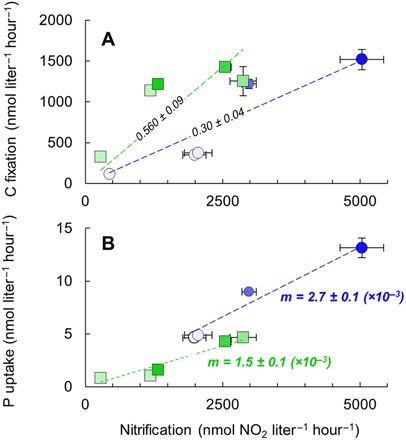
Fig. 2. C and P yields from nitrification by N. maritimus.

Absolute rates of nitrification versus C fixation (A) and Pi uptake (B) by N. maritimus. The slopes of regression lines (R2 > 0.95; P < 0.01) are given in italics (±SE) and represent the C and P yields from nitrification (C0/Nn and Po/Nn, respectively) for strains SCM1 (green) and NAOA6 (blue). The slope standard errors of the regressions shown in (B) are <1.5 × 10⁻⁴. Pi amendment of the growth medium is indicated by the shade of the symbol as defined in Fig. 1. Error bars indicate propagated error of the 95% confidence interval of the slopes of linear rates of radiotracer incorporation or nitrite production over three to five time points among triplicate incubations (N = 9 to 15 for each data point; cf. fig. S3).
