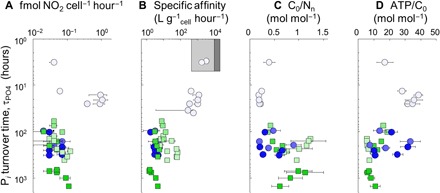
Fig. 3. Trends in N. maritimus physiology and P turnover time.

Changes Pi turnover time (τPO4) in culture medium versus cell-specific nitrification rate (A), specific affinity for Pi (B), C yield (C), and ATP demand (D) of N. maritimus. Each data point represents the value determined for a single time point measurement during the growth phase and/or linear increases in radiotracer uptake (see Materials and Methods); error bars indicate propagated error of measurements of cell density, nitrite production, and/or fraction of 14C or 33Pi uptake (N = 3 for each data point). The shaded boxes in (B) indicate the range expected for pelagic bacterioplankton (gray) and cyanobacteria [dark gray; after (29)]. Pi amendment of the growth medium is indicated by the shade of the symbol as defined in Fig. 1.
