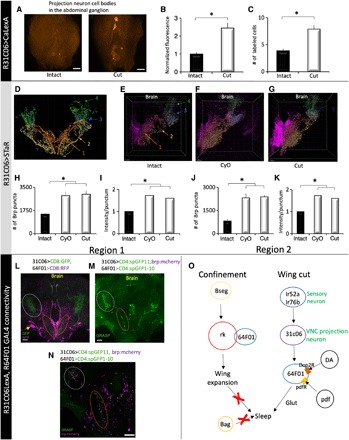
Fig. 6. Wing cut induces structural plasticity in 31C06-GAL4 projection neurons.

(A) Pseudo-colored representative images of 31C06-GAL4/+>CalexA expression in the abdominal ganglion. Wing cut increases the number (B) and intensity (C) of labeled cells compared to intact siblings (n = 8 to 10 flies per condition; *P < 0.01 and *P < 0.01, t test, respectively). (D) Schematic of projections from R31C06-GAL4. Region 1 (orange-red) captures the medial projection, region 2 (gold) reflects the lateral projection, and regions 3 and 4 reflect the lateral and dorsal VLP arborizations of the two projections (see Materials and Methods for details). (E to G) Representative images of BRP puncta in intact (E) and cut (G) R31C06-GAL4/+>STaR flies as well as in R31C06-GAL4/+>CyO/+;STaR flies (F). (H and I) In region 1, the number and intensity of BRP puncta were increased in cut R31C06-GAL4/+>STaR and R31C06-GAL4/+>CyO/+;STaR flies compared to intact controls. (J and K) The number and intensity of BRP puncta were also increased in region 2 in cut R31C06-GAL4/+>STaR and R31C06-GAL4/+>CyO/+;STaR flies compared to intact controls (n = 7 per group; *P < 0.002, Tukey correction). (L) R64F01-GAL4/+>UAS-RFP/+ (magenta) and 31C06LexA+>LexAop-GFP/+ (green) neurites are in close proximity in the SEG (orange ellipse) and the VLP (gray circle). (M) GRASP signal (green) was detected in these regions (orange and gray circles). (N) GRASP signal was adjacent to 31C06LexA presynaptic sites (brp:mcherry, magenta) in SEG and the VLP. (O) Schematic of identified flight and sleep-regulating circuitry. DA, dopamine; pdf, pigment-dispersing factor; Glut, glutamate. (A, L, and M) Maximal intensity confocal projections. (N) Single confocal slice of brain in (M). (E to G) Snapshots from Imaris software. Scale bars, 20 μm.
