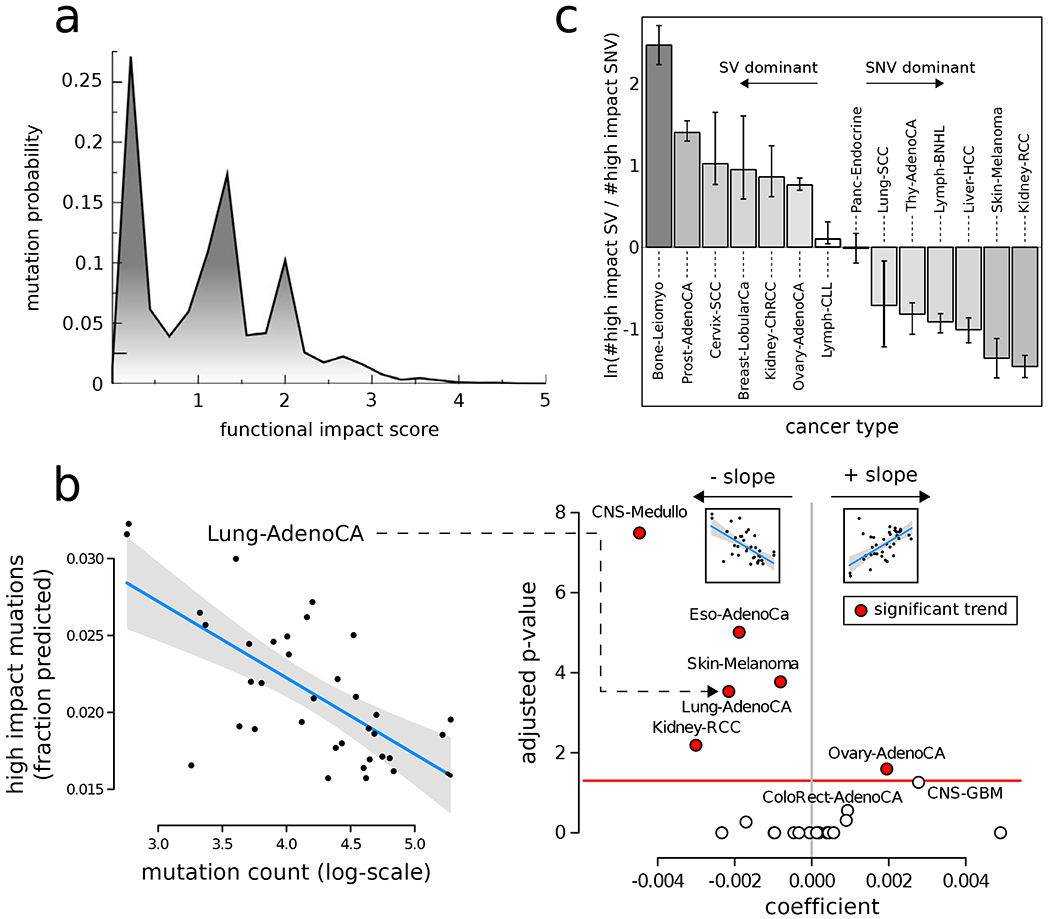
Figure 1: Overall functional impact of PCAWG variants:

a) Functional impact distribution in non-coding (DNase hypersensitive sites averaged across multiple cell lines) regions: three peaks correspond to low-, medium-, and high-impact mutations. b) Correlation between the fraction of high- and medium-impact non-coding SNVs and the total mutational counts for lung adenocarcinoma cohort (left). Scatter plot for correlation coefficient (x-axis) and FDR-corrected p-value for various cancer cohorts (right). c) Log ratio between high-impact SV and SNV frequency in different cancer cohorts. Error bars correspond to variation within the cohort. See also supplement Fig. S1.
