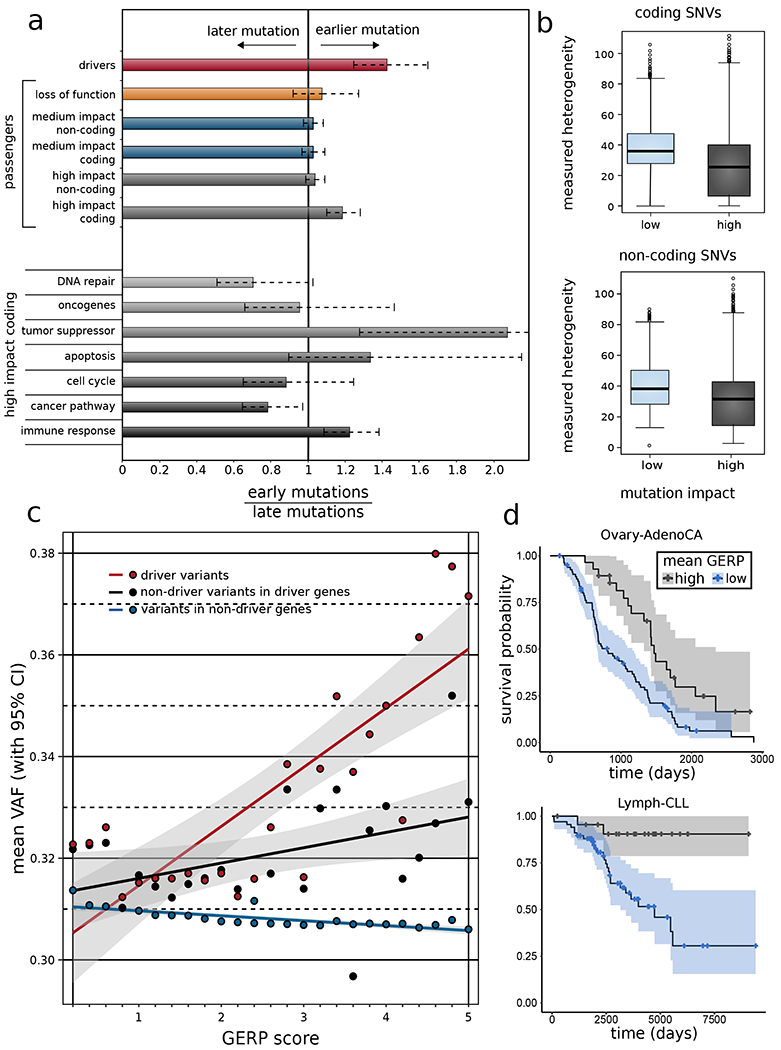
Figure 4: Correlating functional burdening with subclonal information and patient survival:

a) Subclonal ratio (early/late) for different categories of SNVs (coding and non-coding) based on their impact scores. Subclonal ratios for high-impact SNVs occupying distinct gene sets. b) Mutant tumor allele heterogeneity difference comparison between high-, and low-impact SNVs for coding (top) and non-coding (bottom) regions. c) Correlation between mean VAF and GERP score of different categories of variants on a pan-cancer level. d) Survival curves in CLL (left panel) and RCC (right panel) with 95% confidence intervals, stratified by mean GERP score. See also supplement Fig. S4.
