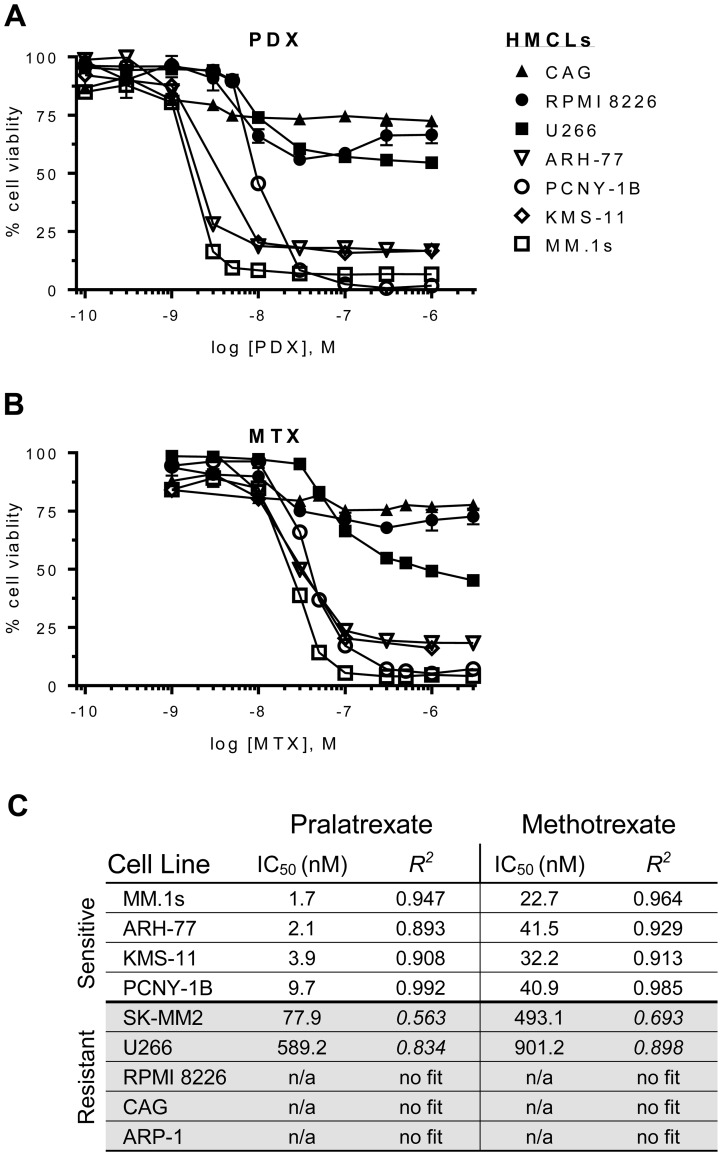
Figure 1. Dose-response curves for antifolates in a panel of HMCLs.
Human multiple myeloma cell lines (HMCLs) were incubated with increasing concentrations of (A) pralatrexate (PDX) or (B) methotrexate (MTX) for 48 hrs. The HMCLs segregated into sensitive (open icons: ARH-77, MM.1s, KMS-11, PCNY-1B) or resistant (filled icons: U266, CAG, RPMI 8226) groupings. (C) An ordered list of half maximal inhibitory concentration (IC50) values for PDX and MTX in HMCLs. The values were determined using an ordinary least squares nonlinear curve fitting method and the goodness of fit was determined valid with an R2 > 0. The curves were normalized to untreated cells (100%) and bortezomib (10–50 nM) treated cells (0%). Data represent the mean ± SD of at least three experiments. Cell viability was determined by an ATP-dependent luciferase-based reporter assay.

