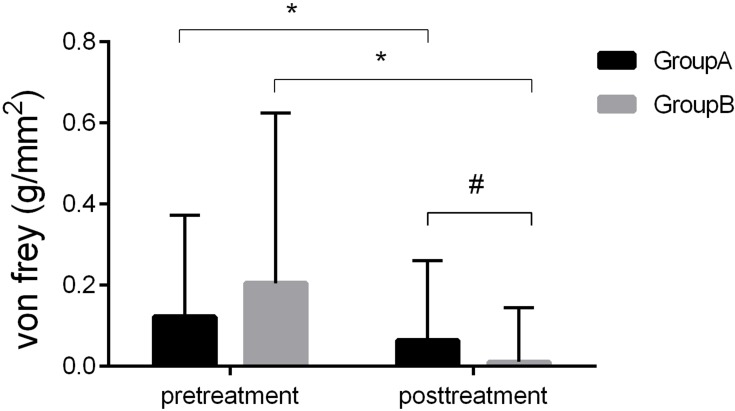
Figure 5.
Changes in von Frey.
Notes: Tactile detection: There was no difference in von Frey of group A and group B before the treatment (P > 0.05). After the ozone therapy, there was a significant decrease in von Frey (*P < 0.05) of group A and group B. Meanwhile, the von Frey of group A and group B have a significant difference after the ozone therapy (#P<0.05).

