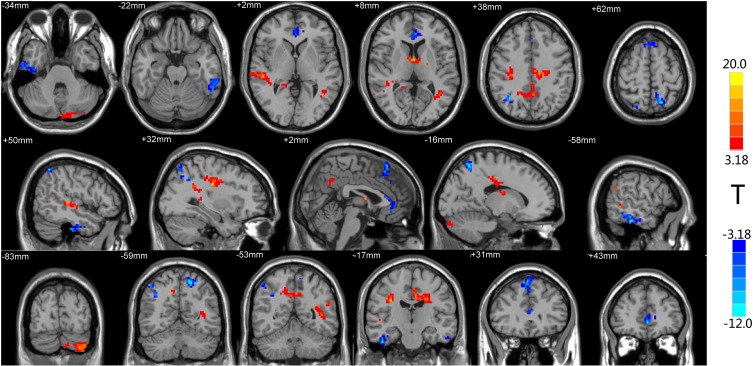
Figure 1.
Brain regions with differential ReHo values after treatment. The distribution of ReHo differential brain areas in the transversal sections (upper row), sagittal sections (middle row), and coronal sections (third row) after treatment. The red and yellow colors indicate higher ReHo value, while blue colors indicate lower ReHo in PHN brain 6 months after treatment, compared with the admission day (P < 0.05, AlphaSim corrected, paired t-test, n=15). Brain areas with increased ReHo mainly in the temporal lobe, cerebellum, cingulate gyrus, and precuneus. Lower ReHo values were detected in the temporal lobe, anterior cingulate gyrus, and frontal lobe (Table 2).

