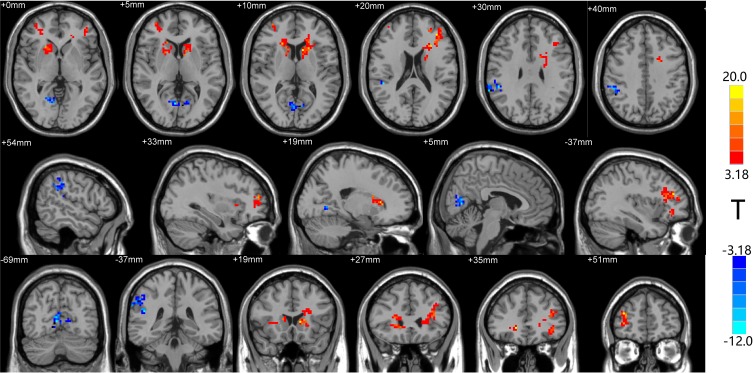
Figure 2.
The distribution of fALFF differential brain areas in PHN patients before and after treatment. The warm colors indicate higher fALFF, and cool colors indicate lower fALFF in PHN brain after treatment (P < 0.05, AlphaSim corrected, paired t-test, n=15). After treatment, brain showed significantly increased fALFF mainly in the bilateral frontal lobe (bilateral middle frontal gyrus, bilateral inferior gyrus, bilateral caudate). Lower fALFF values were observed in the SupraMarginal_R (aal) and Lingual_R (aal). The detailed information for each cluster and their peak T values and coordinates are listed in Table 3.
Abbreviation: aal, anatomical automatic labeling.

